This fourth post in my REF analysis series compares computing sub-panel results across different types of institution.
Spoiler: new universities appear to have been disadvantaged in funding by at least 50%
When I first started analysing the REF results I expected a level of bias between areas; it is a human process and we all bring our own expectations, and ways of doing things. It was not the presence of bias that was shocking, but the size of the effect.
I had assumed that any bias between areas would have largely ‘averaged out’ at the level of Units of Assessment (or UoA, REF-speak typically corresponding to a department), as these would typically include a mix of areas. However, this had been assuming maybe a 10-20% difference between areas; once it became clear this was a huge 5-10 fold difference, the ‘averaging out’ argument was less certain.
The inter-area differences are crucially important, as emphasised in previous posts, for the careers of those in the disadvantaged areas, and for the health of computing research in the UK. However, so long as the effects averaged out, they would not affect the funding coming to institutions when algorithmic formulae are applied (including all English universities, where HEFCE allocate so called ‘QR’ funding based on weighted REF scores).
Realising how controversial this could be, I avoided looking at institutions for a long time, but it eventually became clear that it could not be ignored. In particular, as post-1992 universities (or ‘new universities’) often focus on more applied areas, I feared that they might have been consequentially affected by the sub-area bias.
It turns out that while this was right to an extent, in fact the picture is worse than I expected.
As each output is assigned to an institution it is possible to work out profiles for each institution based on the same measures as sub-areas (as described in the second and third posts in this series): using various types of Scopos and Google scholar raw citations and the ‘world rankings’ adjustments using the REF contextual data tables. Just as with the sub-areas, the different kinds of metrics all yield roughly similar results.
The main difference when looking at institutions compared to the sub-areas is that, of the 30 or so sub-areas, many are large enough (many hundreds of outputs) to examine individually with confidence that the numbers are statistically robust. In contrast, there were around 90 institutions with UoA submissions in computing, many with less than 50 outputs assessed (10-15 people), so getting towards the point were one would expect that citation measures to be imprecise for each one alone.
However, while, with a few exceptions such as UCL, Edinburgh and Imperial, the numbers for a single institution make it hard to say anything definitive, we can reliably look for overall trends.
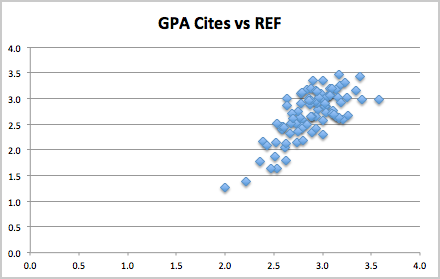
One of the simplest single measures is the GPA for each institution (weighed sum with 4 for a 4*, 3 for a 3*, etc.) as this is a measure used in many league tables. The REF GPA can be compared to the predicted GPA based on citations.
While there is some scatter, which is to be expected given the size of each institution, there is also a clear tendency towards the diagonal.
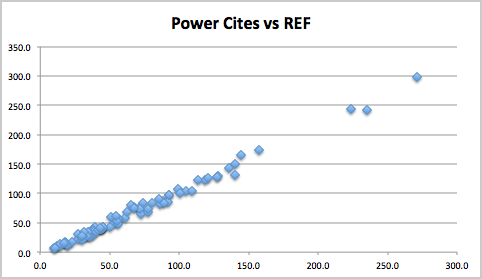
Another measure frequently used is the ‘research power’, the GPA multiplied by the number of people in the submission.
This ‘stretches’ out the institutions and in particular makes the larger submissions (where the metrics are more reliable) stand out more. It is not surprising that this is more linear as, the points are equally scaled by size irrespective of the metric. However, the fact that it clusters quite closely to the diagonal at first seems to suggest that, at the level of institutions, the computing REF results are robust.
However, while GPA is used in many league tables, funding is not based on GPA. Where funding is formulaic (as it is with HEFCE for English universities), the combined measure is very heavily weighted towards 4*, with no money at all being allocated to 2* and 1*.
For RAE2008, the HEFCE weighting was approximately 3:1 between 4* and 3*, for REF2014 funding is weighted even more highly towards 4* at 4:1.
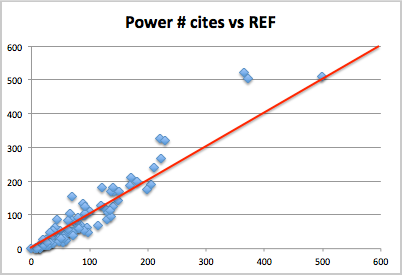
The next figure shows the equivalent of ‘power’ using a 4:1 ratio – roughly proportional to the amount of money under the HEFCE formula (although some of the institutions are not English, so will have different formula applied). Like the previous graphs this plots the actual REF money-related power compared the one predicted by citations.
Again the data is very spread out with three very large institutions (UCL, Edinburgh and Imperial) on the upper right and the rest in more of a pack in the lower left. UCL is dead on line, but the next two institutions look like outliers, doing substantially better under REF than citations would predict, and then further down there is more of a spread, with some below, some above the line.
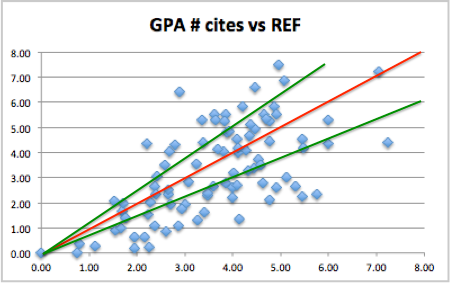
This massed group is hard to see clearly because of the stretching, so the following graph shows the non-volume weighted results, that is simple 4:1 ratio (I have dubbed GPA #). This is roughly proportional to money per member of staff, and again citation-based prediction along the lower axis, actual REF values vertical axis.
The red line shows the prediction line. There is a rough correlation, but also a lot of spread. Given remarks earlier about the sizes of individual institutions this is to be expected. The crucial issue is whether there are any systematic effects, or whether this is purely random spread.
The two green lines show those UoAs with REF money-related scores 25% or more than expected, the ‘winners’ (above top left) and those with REF score 25% or more below prediction, the ‘losers’ (lower right).
Of 17 winners 16 are pre-1992 (‘old’) universities with just one post-1992 (‘new’) university. Furthermore of the 16 old university winners, 10 of these come from the 24 Russell Group universities.
Of the 35 losers, 25 are post-1992 (‘new’) universities and of the 10 ‘old’ university losers, there is just 1 Russell Group institution.
The exact numbers change depending on which precise metric one uses and whether one uses a 4:1, or 3:1 ratio, but the general pattern is the same.
Note this is not to do with who gets more or less money in total, whatever metric one uses, on average, the new universities tend to be lower, the old ones (on average) higher and Russell Group (on average) higher still. The issue here is about an additional benefit of reputation over and above this raw quality effect. For works that by external measures are of equal value, there appears to be at least 50-100% added benefit if they are submitted from a more ‘august’ institution.
To get a feel for this, let’s look at a specific example: one of the big ‘winners’, YYYYYYYY, a Russell Group university, compared with one of the ‘losers’, XXXXXXXX, a new university.
As noted one has to look at individual institutions with some caution as the numbers involved can be small, but XXXXXXXX is one of the larger (in terms of submission FTE) institutions in the ‘loser’ category; with 24.7 FTE and nearly 100 outputs. It also happened (by chance) to sit only one row above YYYYYYYY on the spreadsheet, so easy to compare. YYYYYYYY is even larger, nearly 50 FTE, 200 outputs.
At 100 and 200 outputs, these are still, in size, towards the smaller end of the sub-area groups we were looking at in the previous two posts, so this should be taken as more illustrative of the overall trend, not a specific comment on these institutional submissions.
This time we’ll first look at the citation profiles for the two.
The spreadsheet fragment below shows the profiles using raw Scopos citation measures. Note in this table, the right hand column, the upper quartile is the ‘best’ column.
The two institutions look comparable, XXXXXXXX is slightly higher in the very highest cited papers, but effectively differences within the noise.
Similarly, we can look at the ‘world ranks’ as used in the second post. Here the left hand side is ‘best, corresponding to the percentage of outputs that are within the best 1% of their area worldwide.

Again XXXXXXXX is slightly above YYYYYYYY, but basically within noise.
If you look at other measures: citations for ‘relable years’ (2011 and older, where there has been more time to gather cites), XXXXXXXX looks a bit stronger, for Google-based citations YYYYYYYY looks a bit stronger.
So, except for small variations, these two institutions, one a new university, one a Russell Group one, look comparable in terms external measures.
However, the REF scores paint a vastly different picture. The respective profiles are below:
Critically, the Russell Group YYYYYYYY has more than three times as many 4* outputs as the new university XXXXXXXX, despite being comparable in terms of external metrics. As the 4* are heavily weighted the effect is that the GPA # measure (roughly money per member of staff) is more than twice as large.
Comparing using the world rankings table: for the new university XXXXXXXX only just over half of their outputs in the top 1% worldwide are likely to be ranked a 4*, whereas for YYYYYYYY nearly all outputs in the top 5% are likely to rank 4*.
As noted it is not generally reliable to do point comparisons on institutions as the output counts are low, and also XXXXXXXX and YYYYYYYY are amongst the more extreme winners and losers (although not the most extreme!). However, they highlight the overall pattern.
At first I thought this institutional difference was due to the sub-area bias, but even when this was taken into account large institutional effects remained; there does appear to be an additional institutional bias.
The sub-area discrepancies will be partly due to experts from one area not understanding the methodologies and quality criteria of other areas. However, the institutional discrepancy is most likely simply a halo effect.
As emphasised in previous posts the computing sub-panels and indeed everyone involved with the REF process worked as hard as possible to ensure that the process was as fair, and, insofar as it was compatible with privacy, as transparent as possible. However, we are human and it is inevitable that to some extent when we see a paper from a ‘good’ institution we are expecting it to be good and visa versa.
These effects may actually be relatively small individually, but the heavy weighting of 4* is likely to exacerbate even small bias. In most statistical distributions, relatively small shifts of the mean can make large changes at the extremity.
By focusing on 4*, in order to be more ‘selective’ in funding, it is likely that the eventual funding metric is more noisy and more susceptible to emergent bias. Note how the GPA measure seemed far more robust, with REF results close to the citation predictions.
While HEFCE has shifted REF2014 funding more heavily towards 4*, the Scottish Funding Council has shifted slightly the other way from 3.11:1 for RAE2008, to 3:1 for REF2014 (see THES: Edinburgh and other research-intensives lose out in funding reshuffle). This has led to complaints that it is ‘defunding research excellence‘. To be honest, this shift will only marginally reduce institutional bias, but at least appears more reliable than the English formula.
Finally, it should be noted that while there appear to be overall trends favouring Russell Group and old universities compared with post-1992 (new) universities; this is not uniform. For example, UCL, with the largest ‘power’ rating and large enough that it is sensible to look at individually, is dead on the overall prediction line.


Pingback: REF Redux 6 — Reasons and Remedies | Alan Dix