In statistics the mode of a probability distrubution or frequency histogram is a peak, that is a value with the highest probability locally. For many distributions, for example the normal distribution there is a single mode, but some have two (bi-modal) or more modes. These distributions with multiple modes often occur when the data comes from a number of different kinds of sources or populations, each with their own mode.
In a user interface the term 'mode' refers to states of the system where the users raw actions (keypress, touchpoint, etc.) are interpretted dfferently.
Used in Chap. 7: page 94
Used in glossary entries: Normal distribution
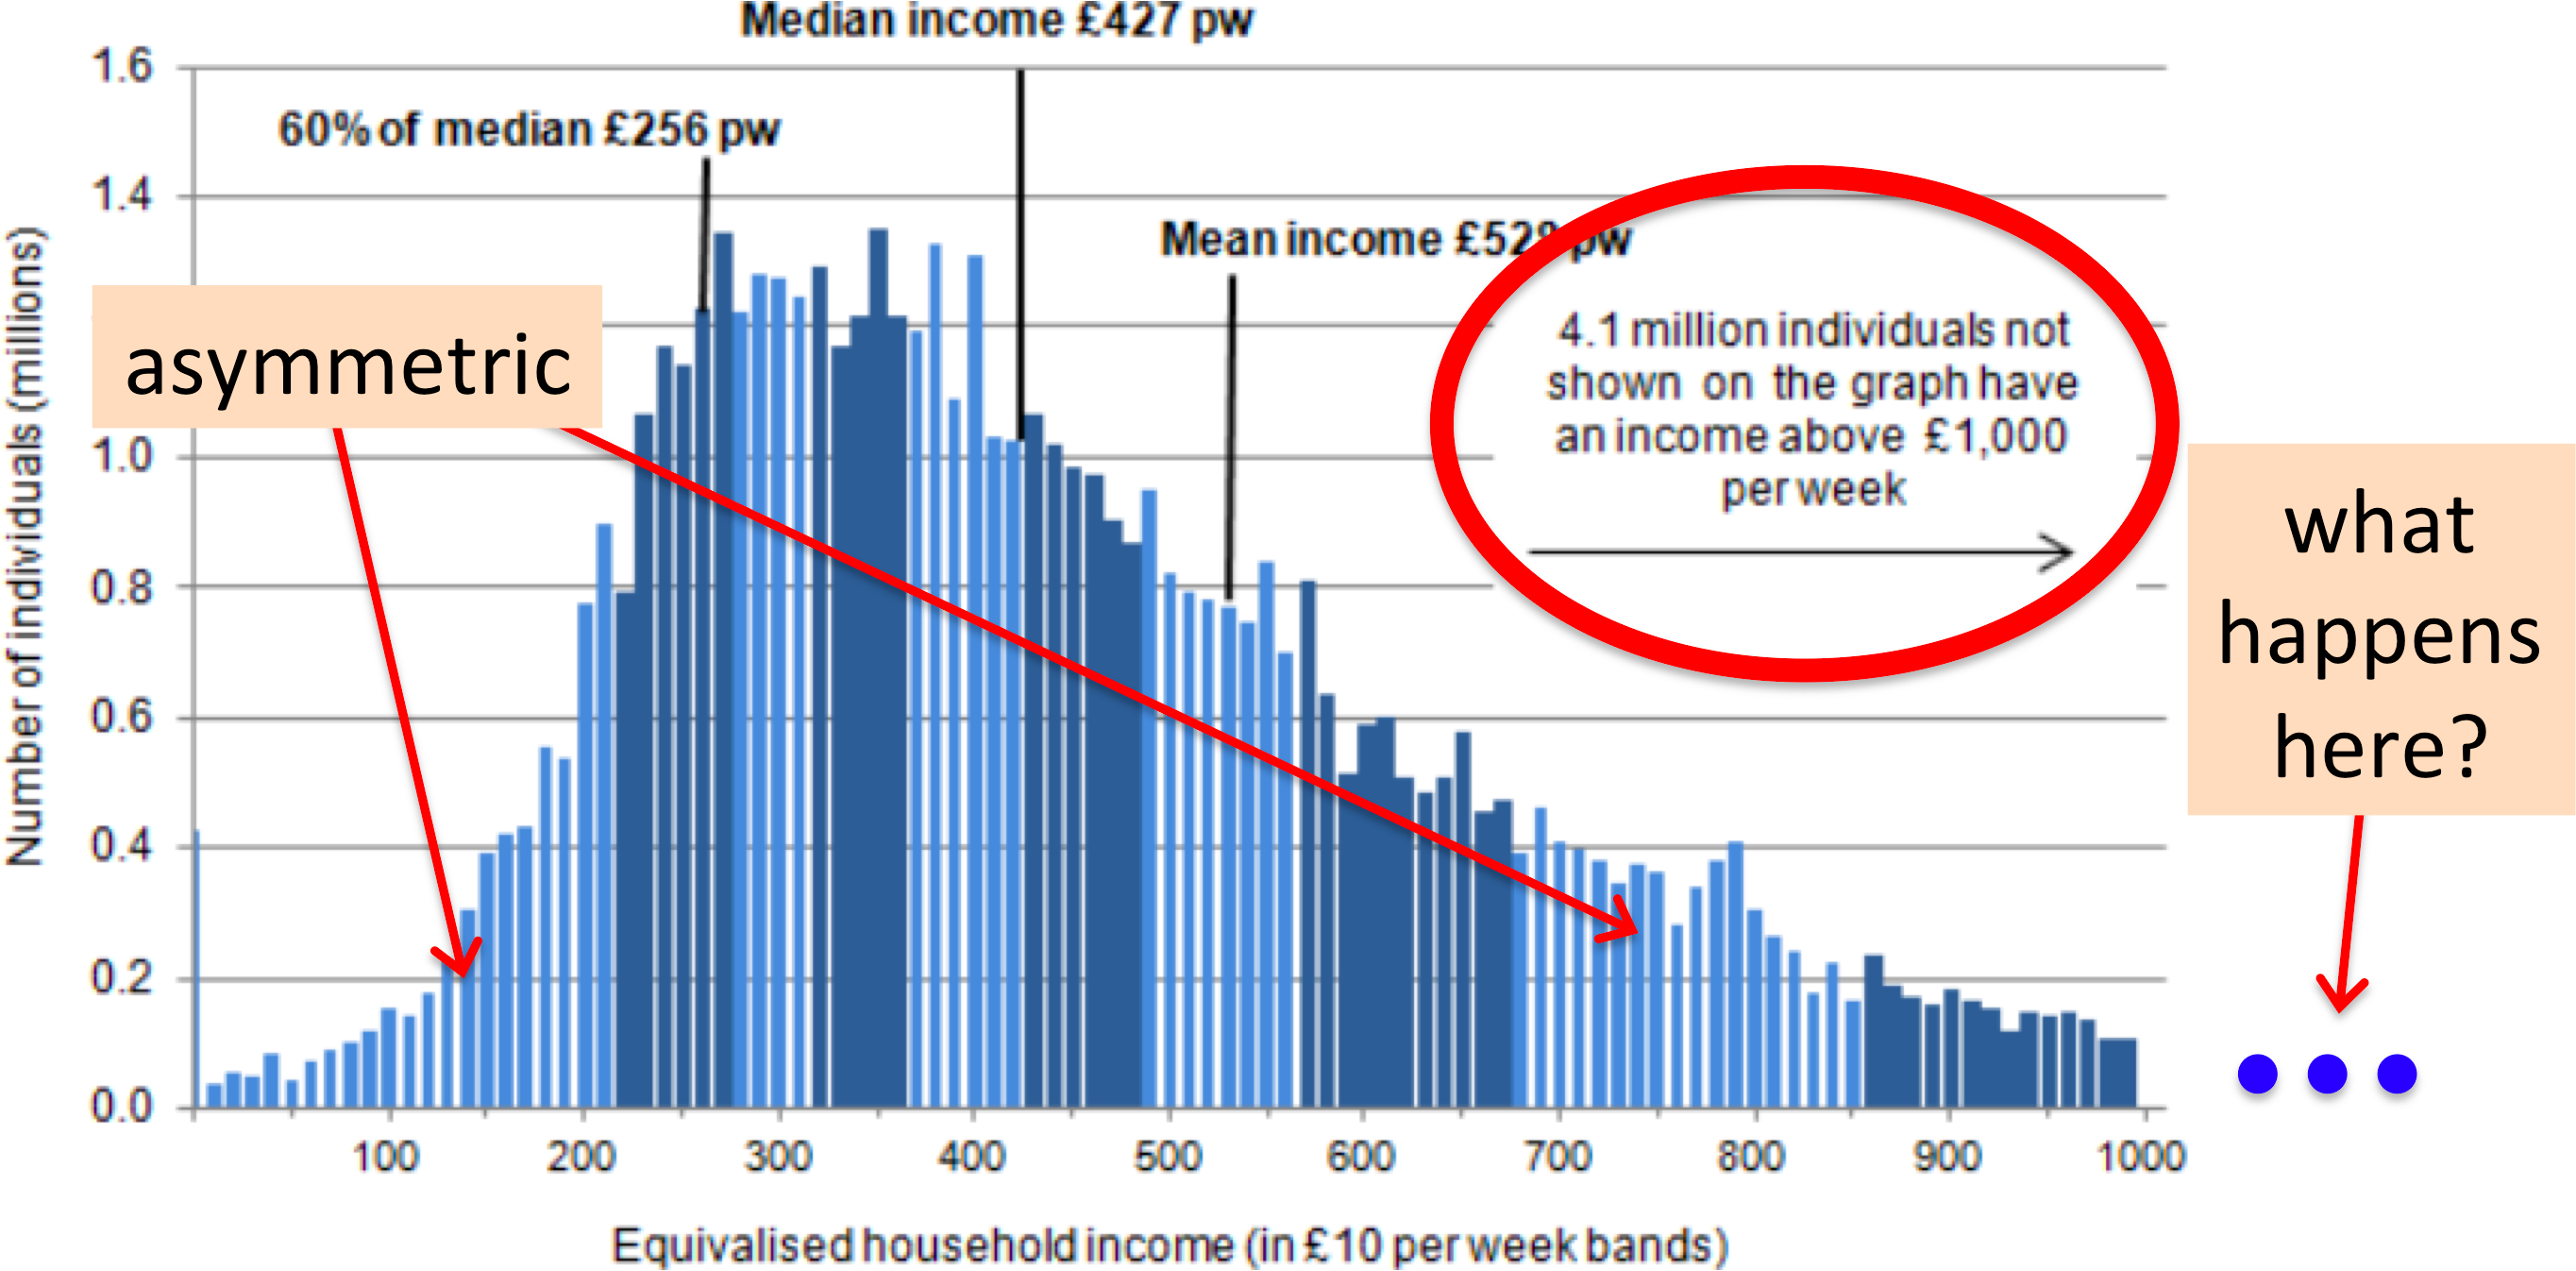
Income data for the UK. The mean and mode are around £530 and £430 per week respectively. As the data is quite jagged the mode(s0 is quite hard to discern, but if the data were smoothed the mode would be closer £330.