An ROC diagram or ROC curve is a visualisation of the precision-recall trade-off. A ROC diagram can also be used to help choose between classifiers.
Used in Chap. 9: pages 120, 121, 128, 129, 130; Chap. 18: pages 284, 290; Chap. 19: page 305
Also known as: receiver operating characteristic, ROC curve, ROC curves
Used in glossary entries: precision–recall trade-off

ROC curve – trade-off between false positive and false negative rates
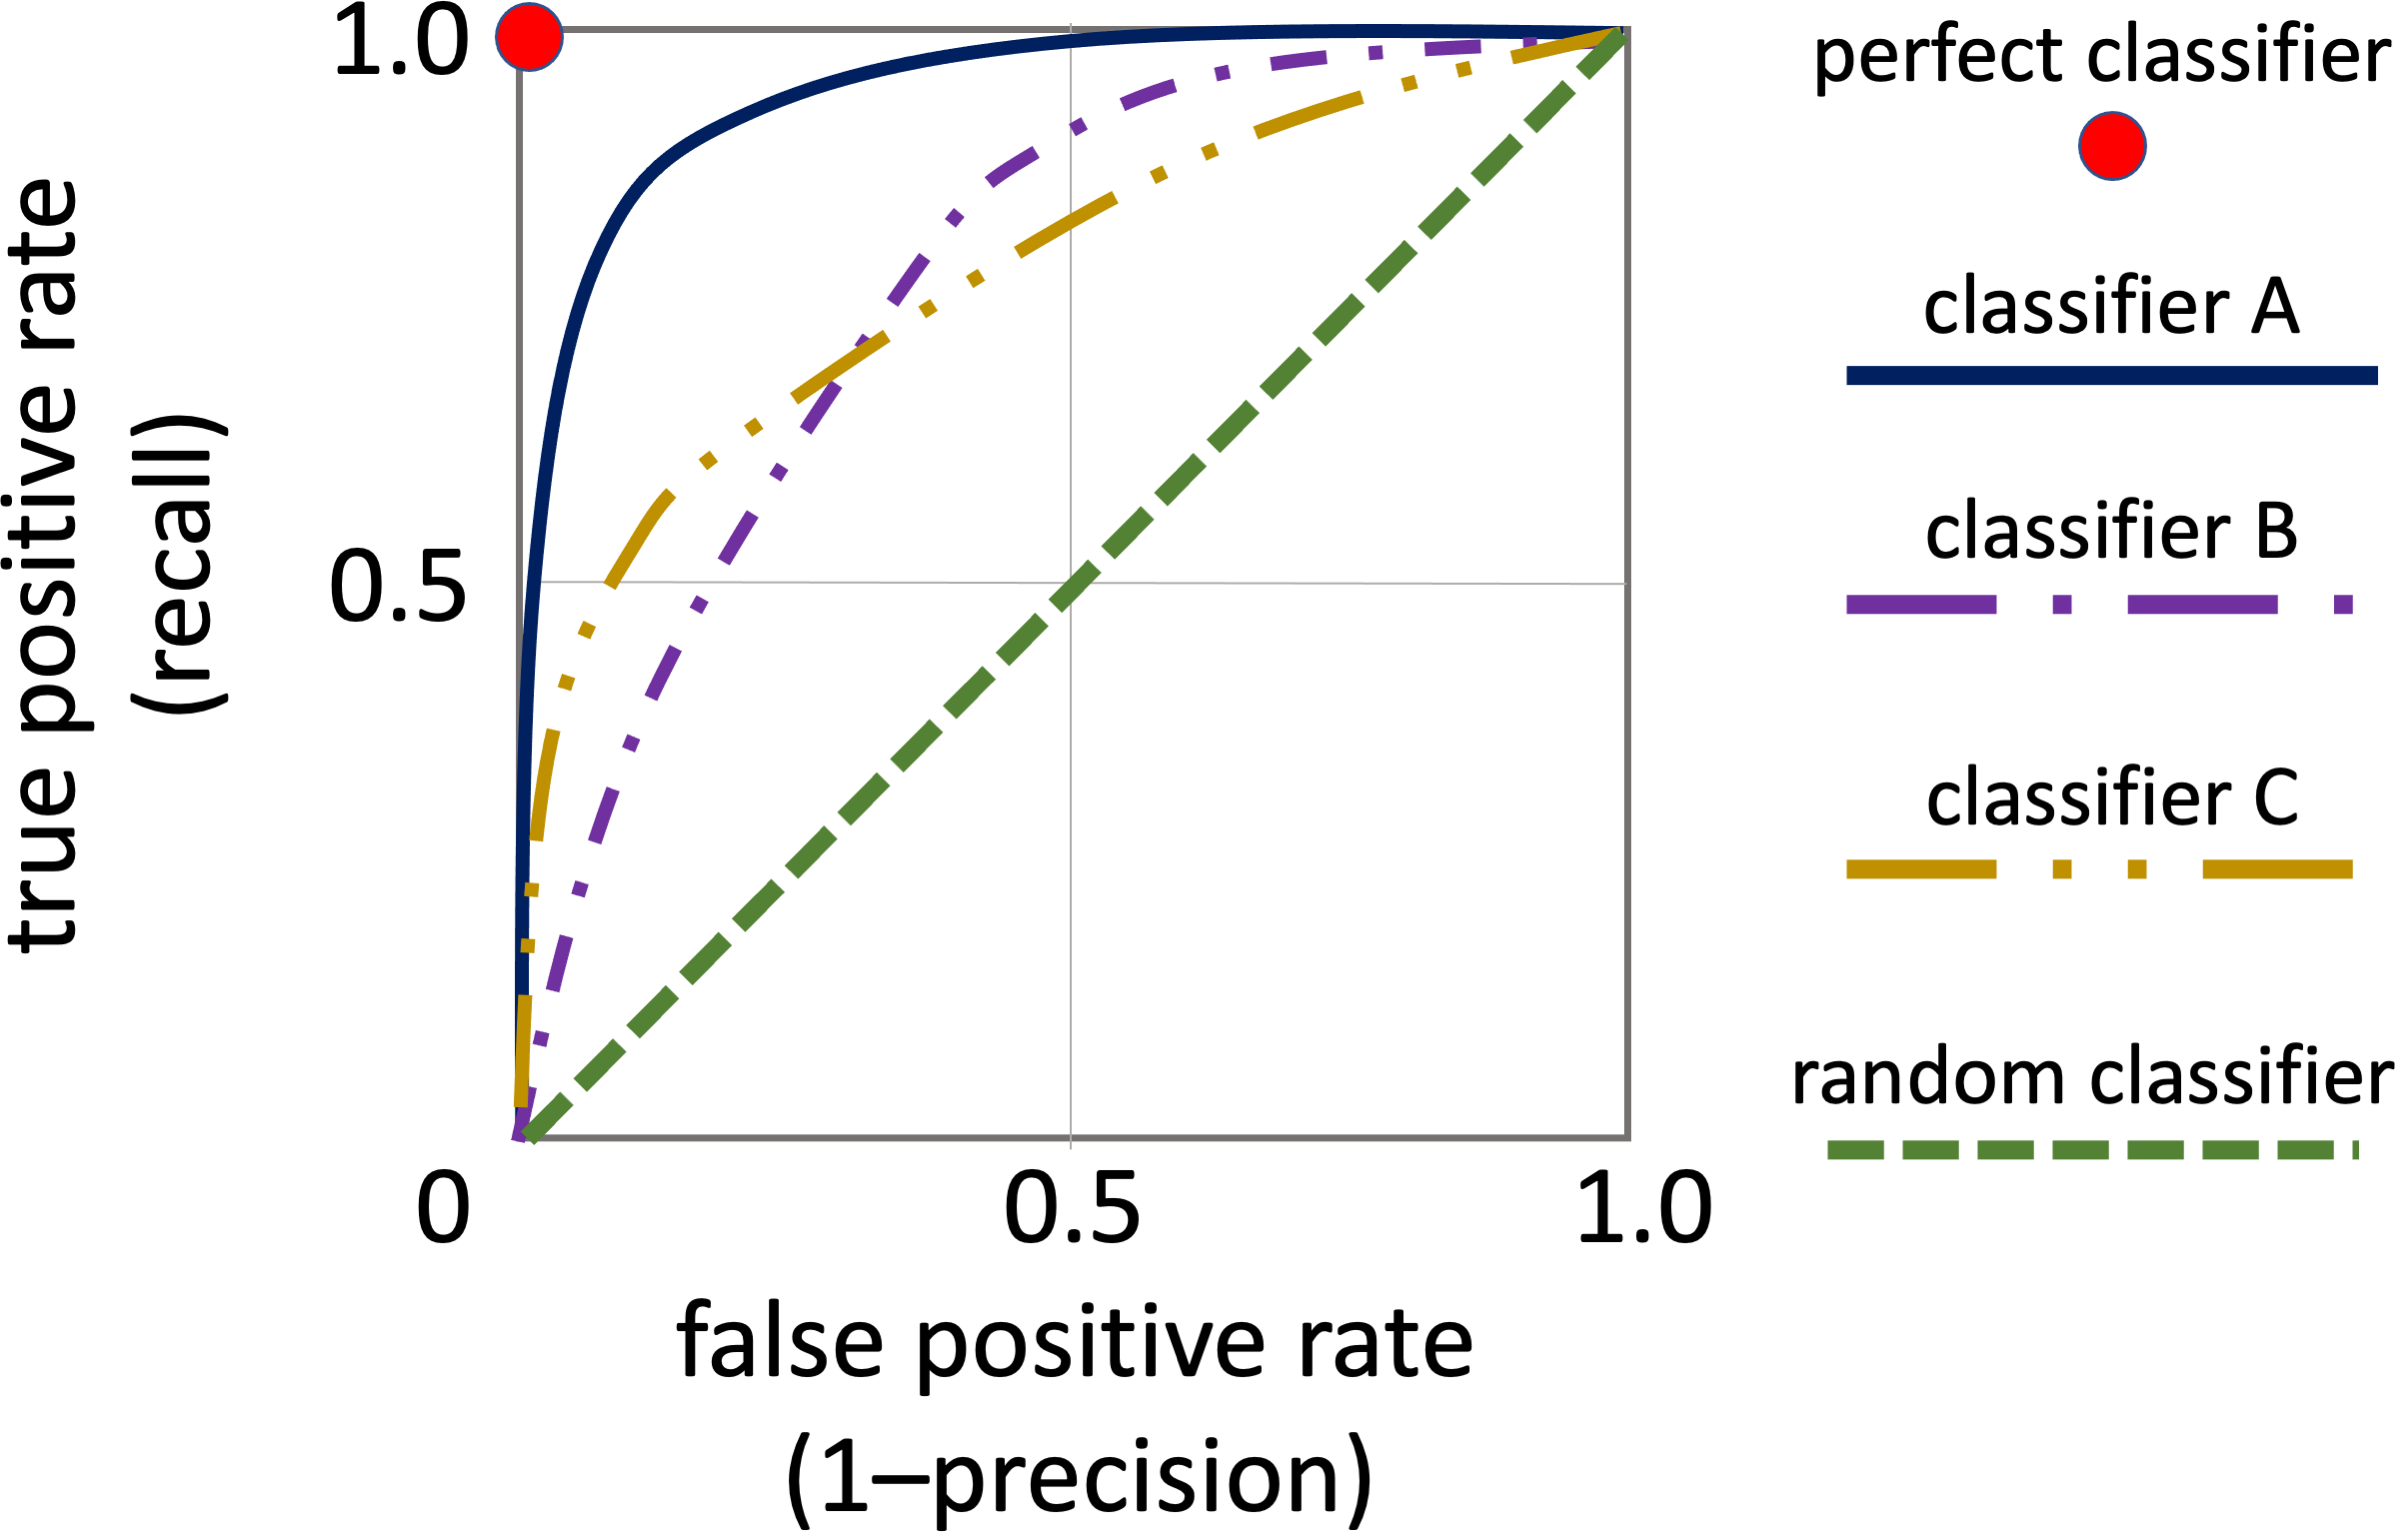
ROC curve – choosing between classifiers