Visual analytics combines visualisation, machine learning and statistical analysis in an interactive system to aid human sense making and decision making especially when dealing with complex data.
Used in Chap. 18: pages 271, 272, 284, 286, 287, 289, 291, 292
Used in glossary entries: machine learning, visualisation
Links:
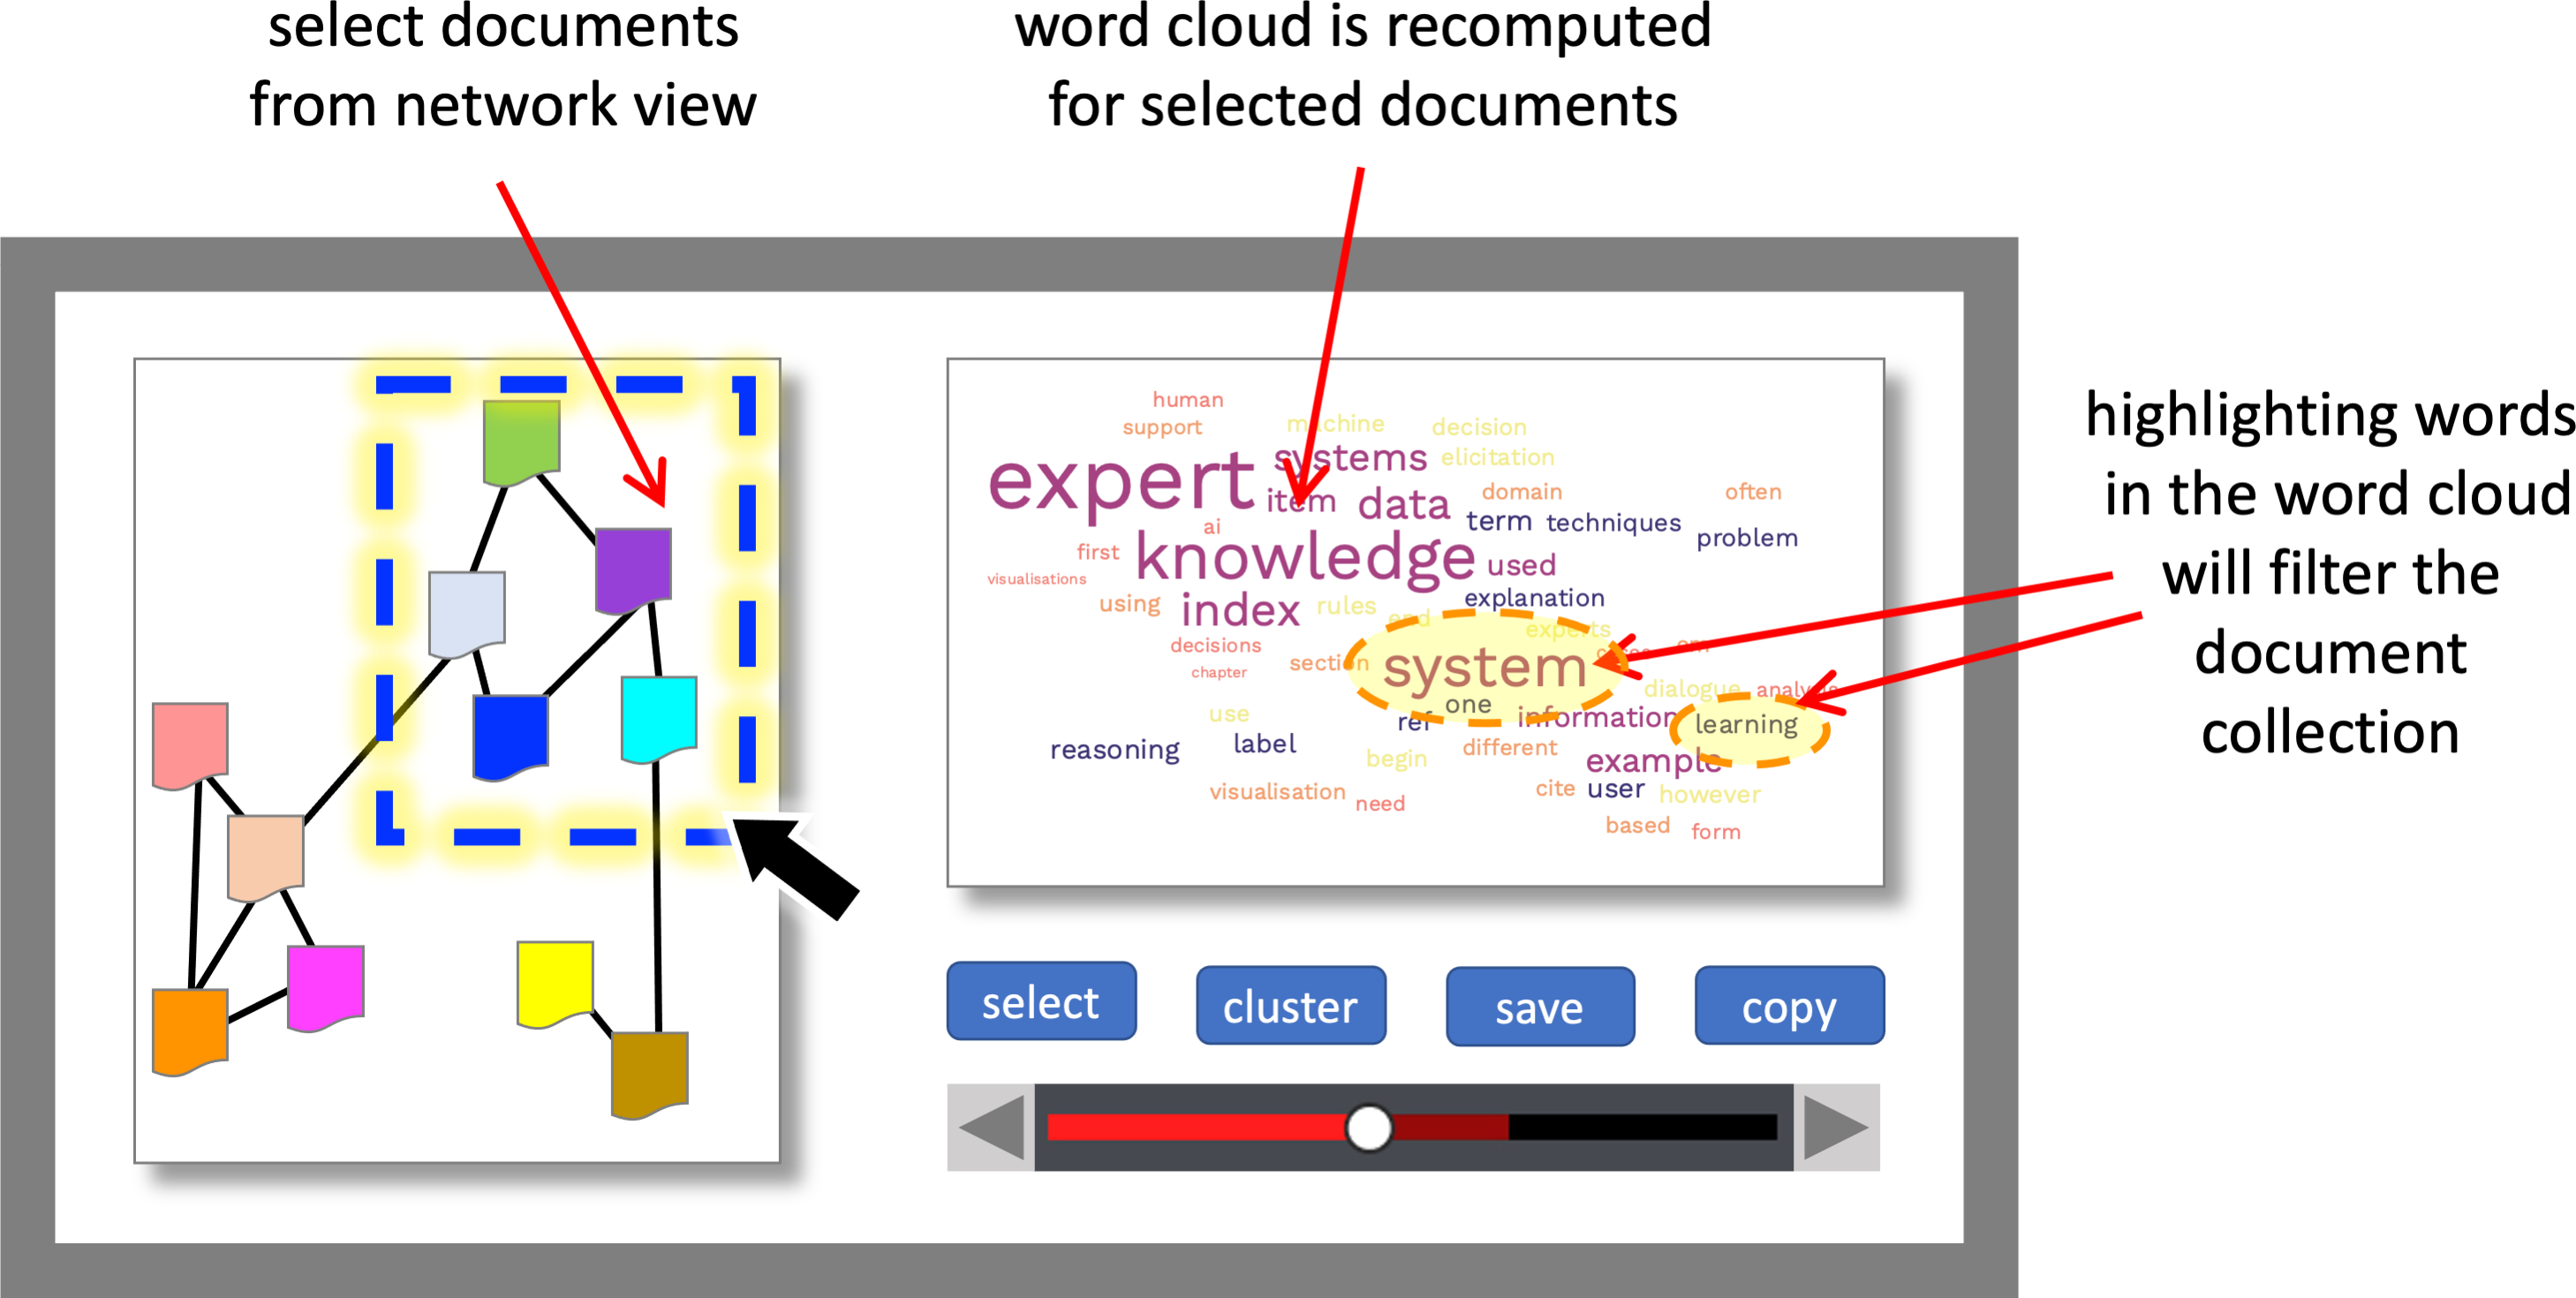
Connected visualisations.