
The TreeMap is a constant area visualisation invented by Ben Shneiderman for hierarchical data with some form of numerical attribute, for example the sizes of files and folders on a computer disk. The most basic form starts with a rectangular area and then recursively divides the area alternatively horizontally using the total values for each level.
Also used in hcistats2e: Chap. 14: page 179
Used in glossary entries: constant area visualisation
Links:
 cs.umd.edu: Treemaps for space-constrained visualization of hierarchies
- Wikipedia: Treemapping
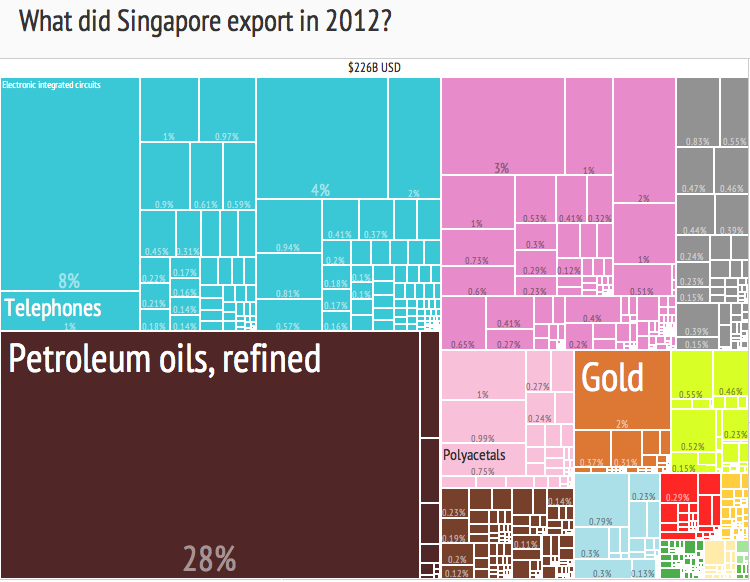
Treemap of Singapore Exports in 2012 organised by product type. Gordon.silvermanaz, CC BY-SA 4.0, via Wikimedia Commons