
All raw data was obtained from the REF2021 results and submissions database for UoA11, Computer Science and Informatics [REF21a] and the REF2021 – Results and submissions – Environment submissions database [REF21b]. Full details of this procedure can be found in Appendix A.
Two of the downloadable CSV files were used. One has four rows for each institution listing a profile of 4*,3*, 2*, 1* and unclassified results for Overall, Outputs, Impact and Environments (Fig. 1). The other has fifteen rows for each institution listing various types of income source (excluding QR) and an overall total over different year ranges (Fig. 2). There is also an income-in-kind spreadsheet, but this appears very partial and has not been used for this analysis.
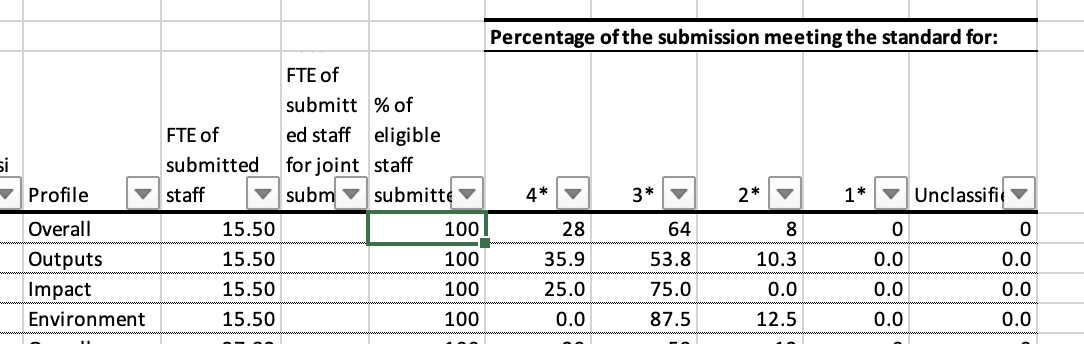
Fig 1. Results spreadsheet detail (example entry, University of Aberdeen)
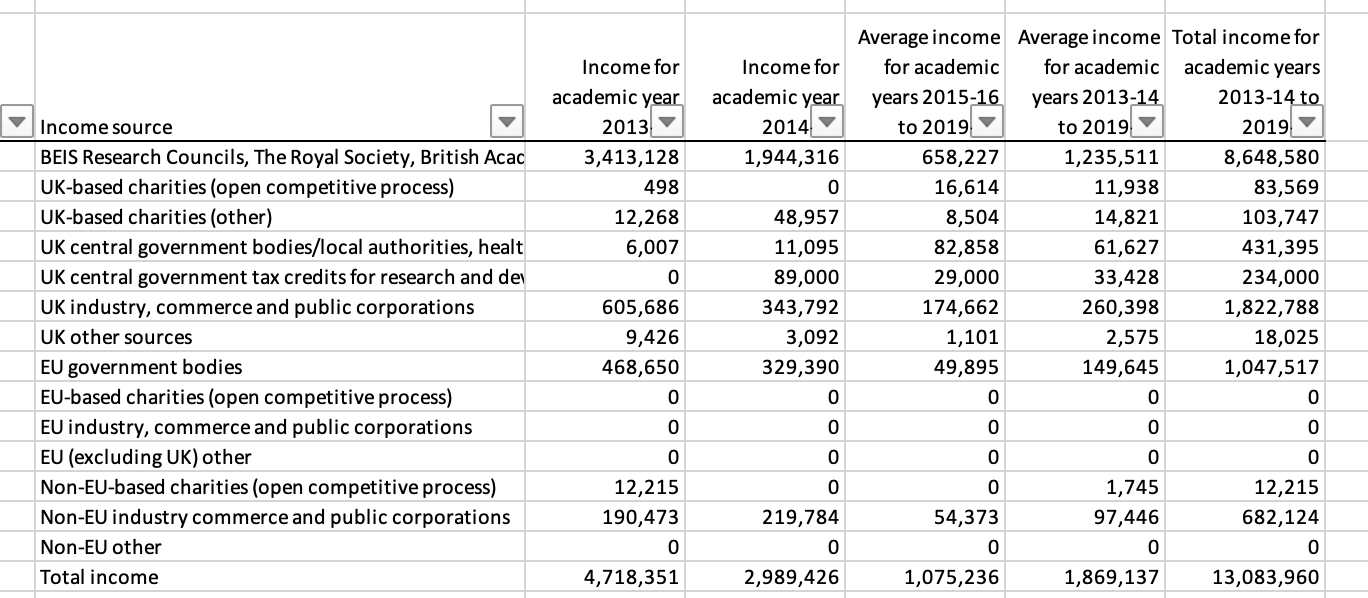
Fig 2. Income spreadsheet detail (example entry, University of Aberdeen)
These CSV files were combined using bespoke code to create a single JSON file and then an extract of this used to create a summary spreadsheet (Fig. 3), which was used for subsequent analysis. The summary spreadsheet has one row per institution including all of the profiles and three of the income figures. This analysis only used the total income from all sources as there were so many subcategories. It would be possible to repeat the analysis focusing on specific categories, for example UKRI income. The summary spreadsheet includes the figures for ‘average income for academic years 2015-16 to 2019-20’, ‘average income for academic years 2013-14 to 2019-20’ and ‘total income for academic years 2013-14 to 2019-20’, but only the last was used in the value for money calculations as the three figures correlate strongly.
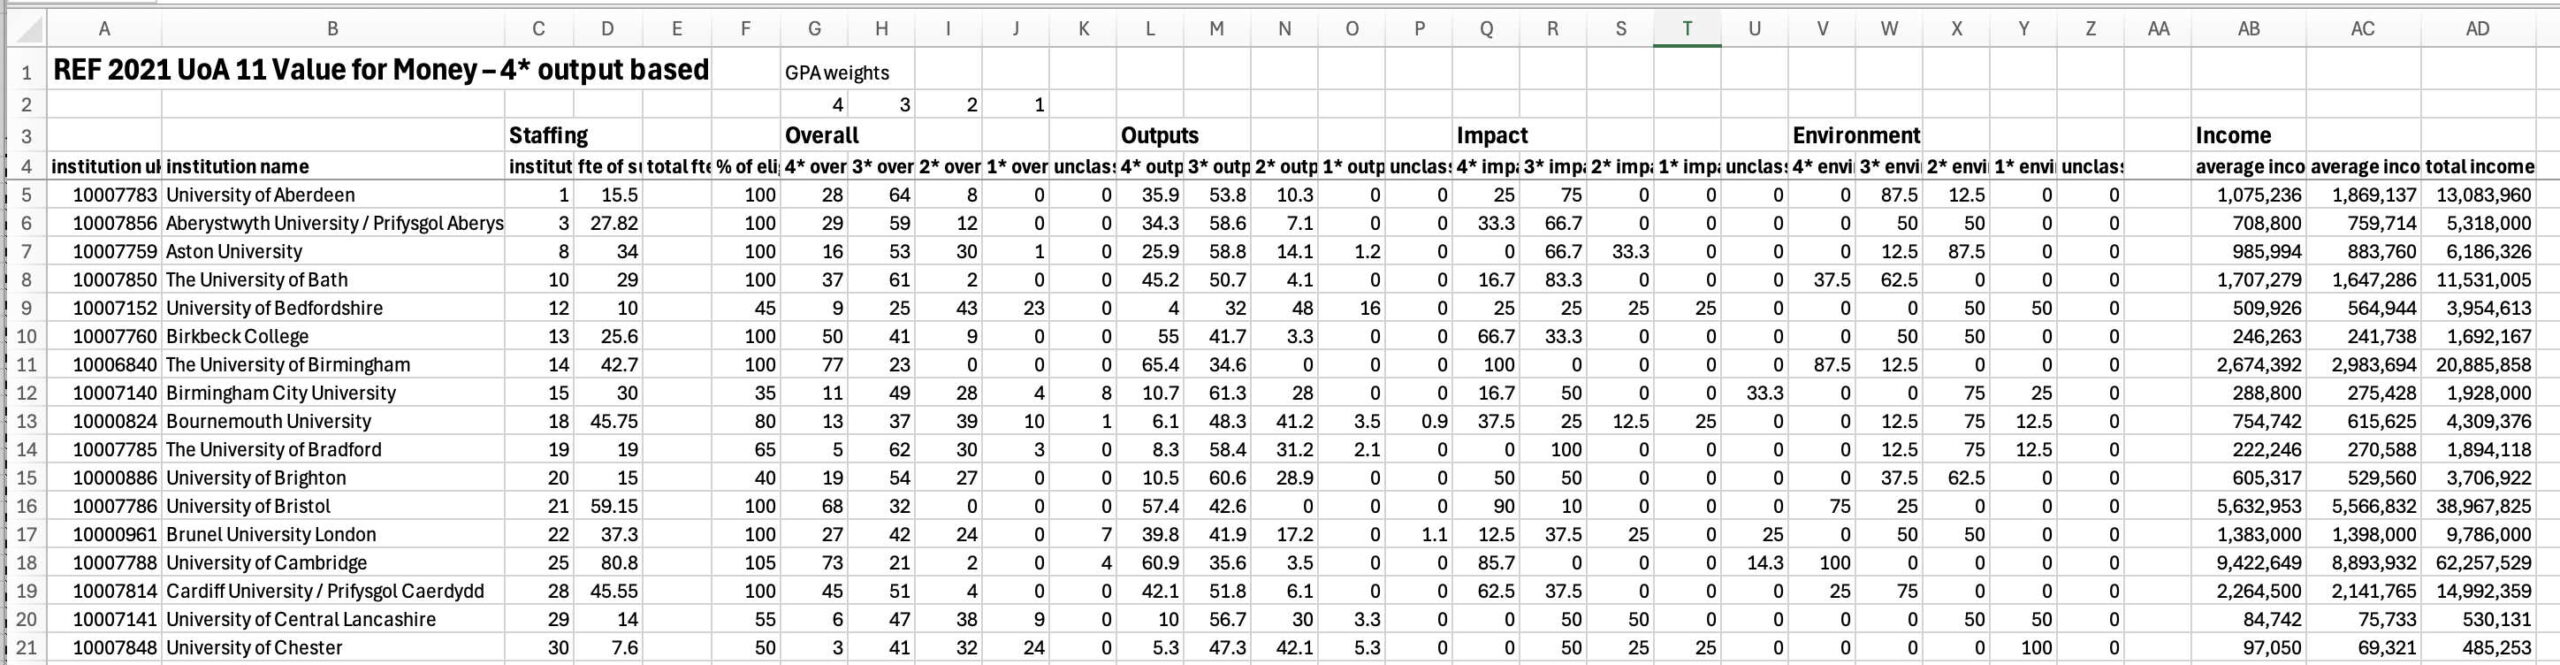
Fig 3. Combined spreadsheet detail
This data was then used to look at three overall quality metrics and corresponding value-for-money measures. The quality metrics used were:
- overall GPA – This uses the overall profile (itself a 60%:25%:15% weighted sum of the output, impact and environment profiles) and then weights the 4*, 3*, 2* and 1* scores by 4,3,2,1 respectively. This form of GPA is widely used on university websites.
- overall ‘QR’ formula – This uses the same output profile, but weights 4*, 3*, 2* and 1* scores by 4,1,0,0 respectively, following the Research England funding model [RE23, p.15].
- 4* outputs only – This just counted the 4* rated outputs. Some academics would regard this as the gold standard for research discounting the value of impact. While this is a diminishing viewpoint in modern academia, it allows an extreme point to be measured.
To turn this into a quality for money measure the raw score was multiplied by the volume of the submission (FTE submitted column) to give a quality volume. This is because the actual number of outputs and impact case studies is roughly proportionate to the submission size. For environment, the multiplier is less clear, however the quality of the environment affects more staff in a bigger submission and many costs (travel, etc.) are proportionate to the staff base, so multiplying the raw environment score by volume also seems appropriate. The quotient of this quality volume and the total income then gives a cost per unit of quality and value for money metric.