4.1 Overall GPA based orderings
Figure 4 shows the top and bottom of the table of institutions ordered by UoA11 overall GPA. The top few institutions are exactly as one would expect: Imperial, Oxford, and other Russell group members. Similarly at the bottom of the table are teaching-intensive post-1992 institutions such as Wolverhampton, and Wrexham.
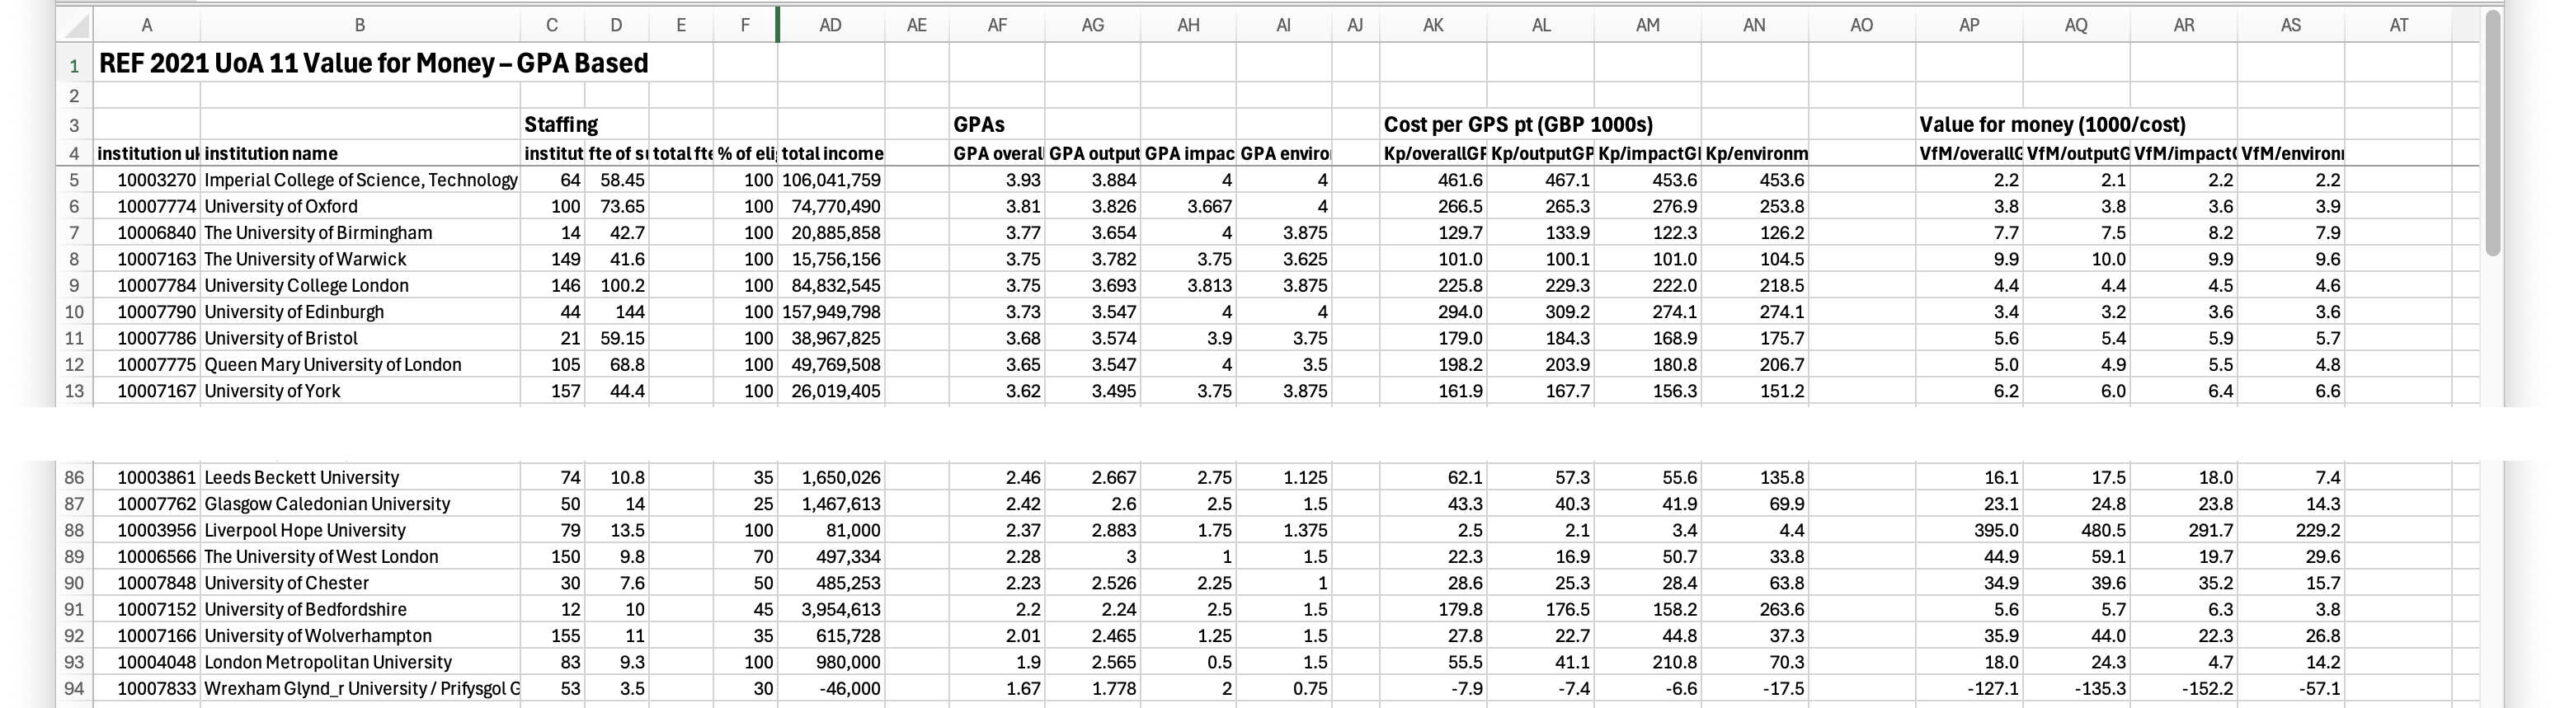
Fig 4. Ordered by GPA value (column AF)
However, if we reorder by the value for money criterion (Fig. 5), a completely different picture emerges. Now Liverpool Hope and UCLAN lead the table as giving the best GPA per pound of research investment. Notably, while some are based on small submissions, so could be argued to be subject to noise, others, notably Northumbria, have a substantial submission. Birkbeck is the only pre-1992 institution in the top ten (Loughborough is next at slot 13).
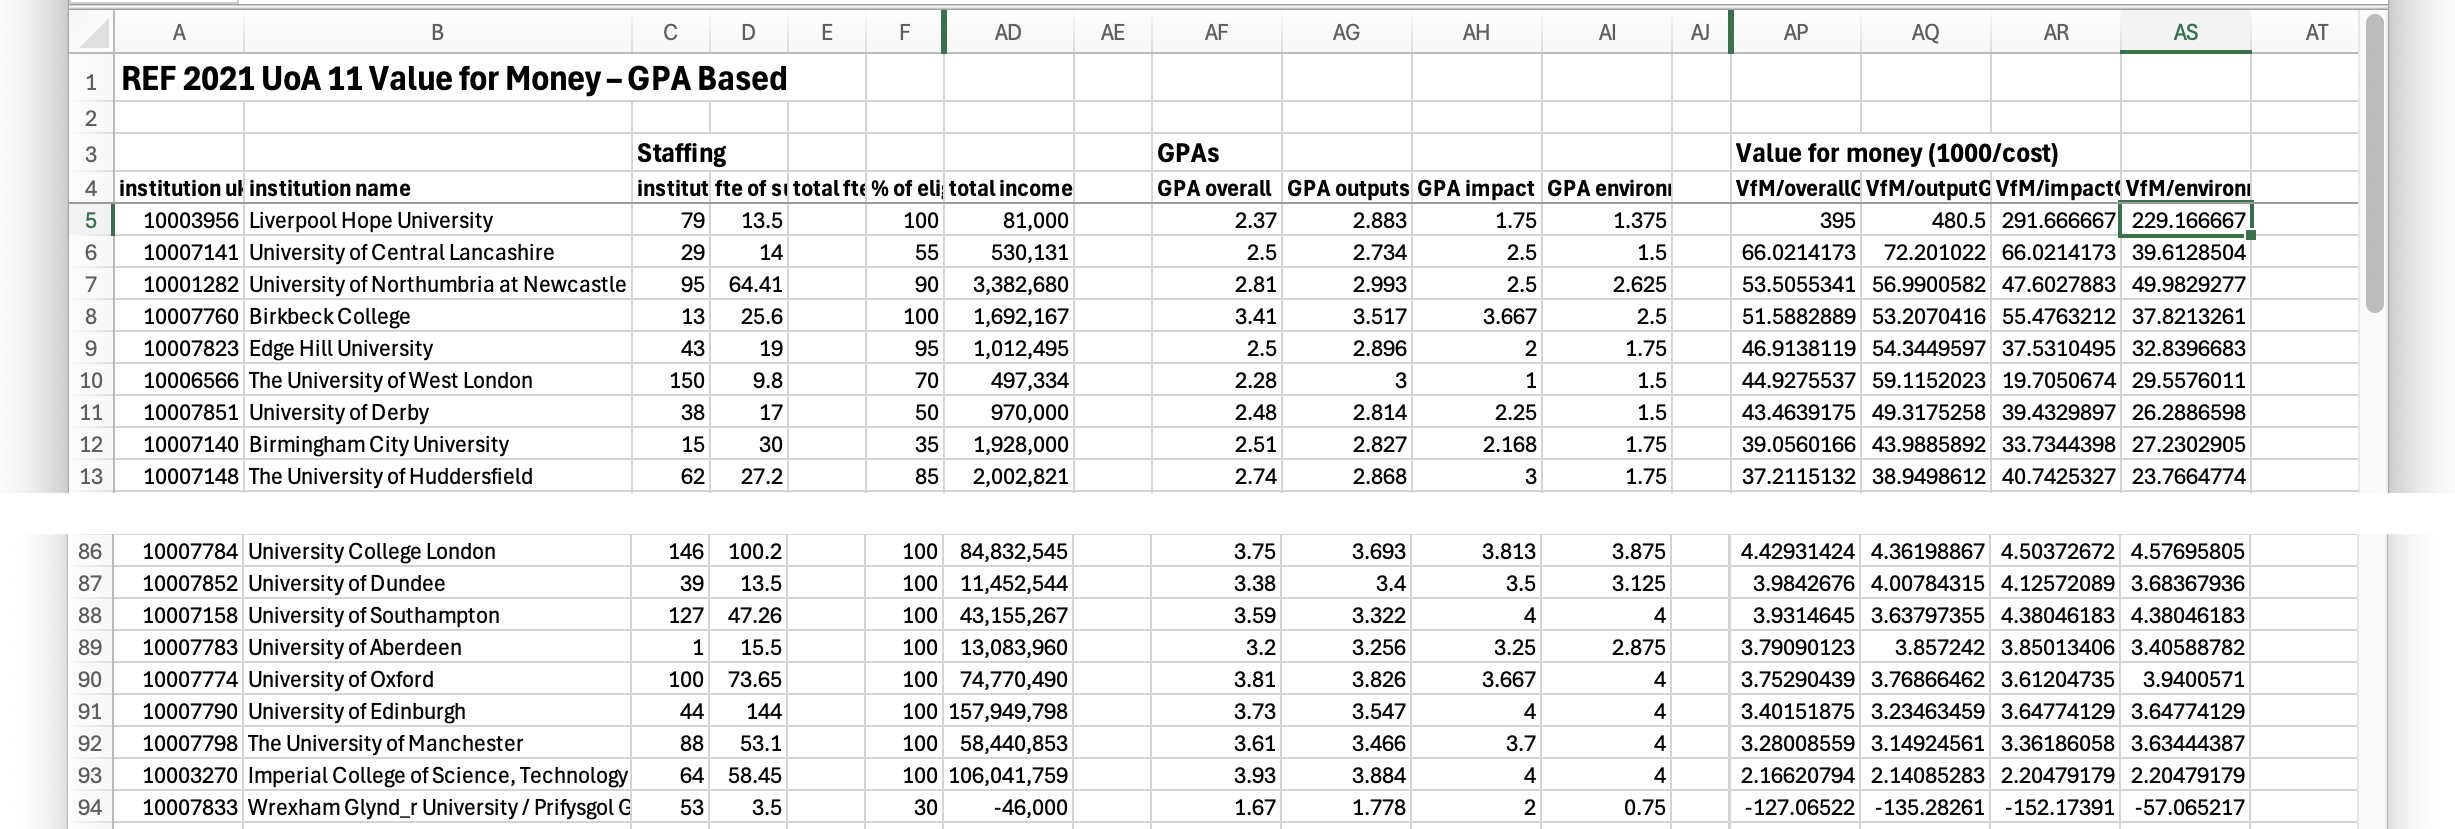
Fig 5. Ordered by GPA value for money (column AP)
The bottom of the table is now almost a complete reverse of the raw GPA ordering with Imperial, Manchester, Edinburgh and Oxford at the tail. Wrexham is an outlier as it recorded negative research income for the period, so while it is included in Figure 5 for completeness and transparency, it should be disregarded for most purposes.
Note too that the value for money ratio between the top and low end of the table (ignoring Liverpool Hope as it is another outlier) is 30:1, that is it costs twenty to thirty times more to get a similar ‘GPA worth’ of output at universities such as Imperial or Manchester compared to those such as UCLAN or Northumbria.
The exact figures for each individual institution should not be read too precisely as there are many local factors that need to be taken into account. However, the overall pattern is clear with institutions that would normally (and largely rightly) be regarded as the front runners in terms of overall research quality faring far less well in terms of value for money compared with those that would be regarded as far lower in terms of research esteem.
4.2 Overall QR-formula based orderings
The results for using the QR-formula follow a roughly similar pattern with expected institutions (Imperial, Oxford, Birmingham) leading the raw value table (Fig. 6), and post-1992 institutions (London Met, Wolverhampton, Wrexham) at the bottom.
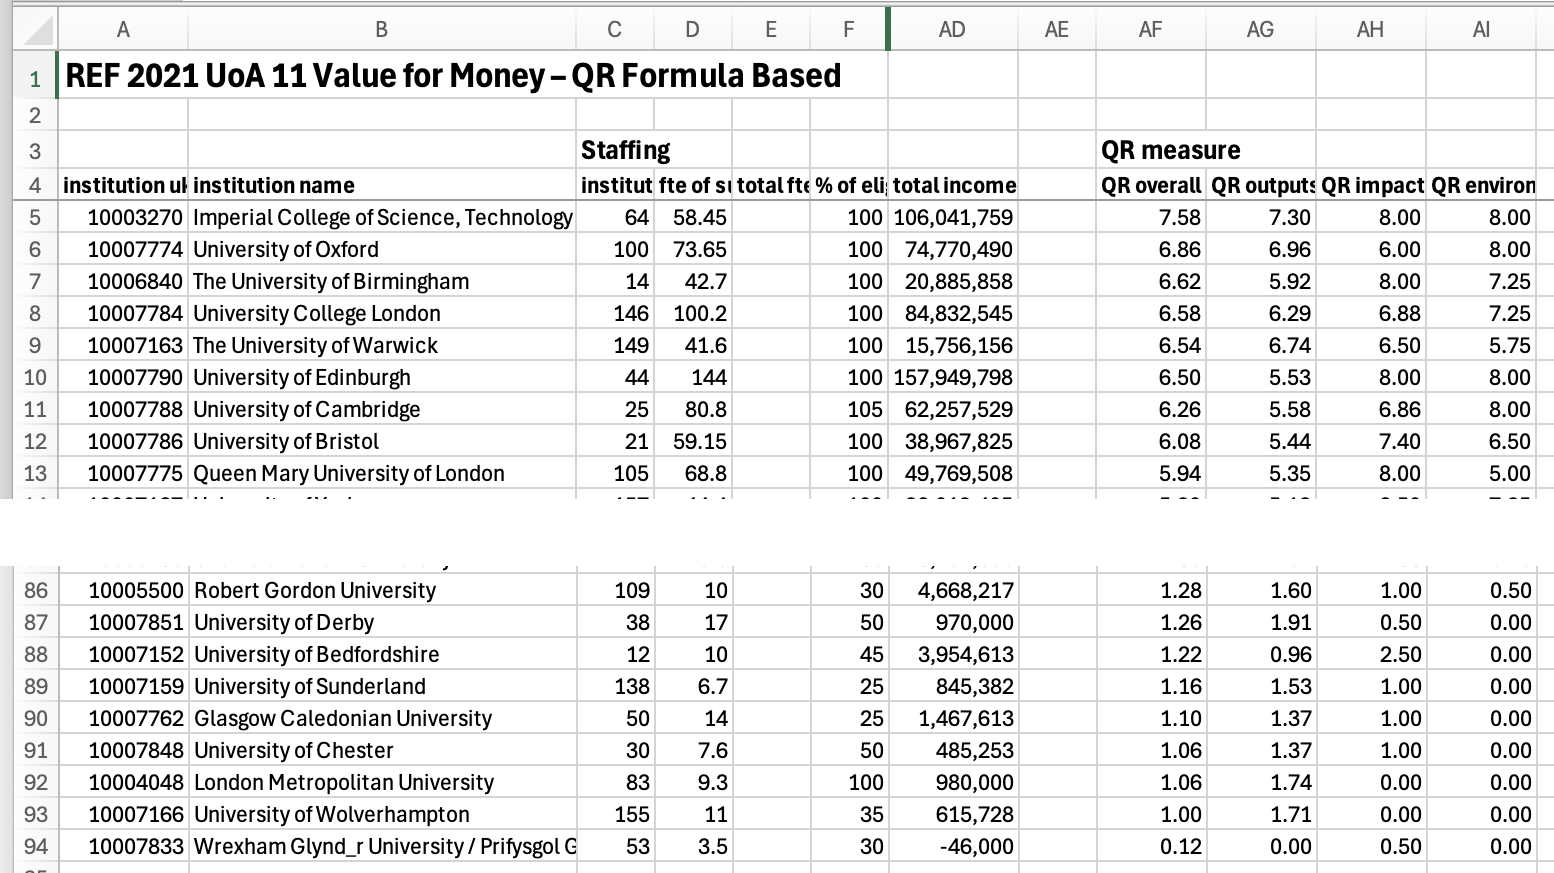
Fig 6. Ordered by overall QR–formula weighting (column AF)
However, just as with the GPA-based measures, the value-for-money ordering (Fig. 7) radically changes this picture. The top is dominated by post-1992 institutions: Liverpool Hope, Northumbria, UCLAN, etc.) with Birkbeck again a notable exception and Loughborough also in the top ten.
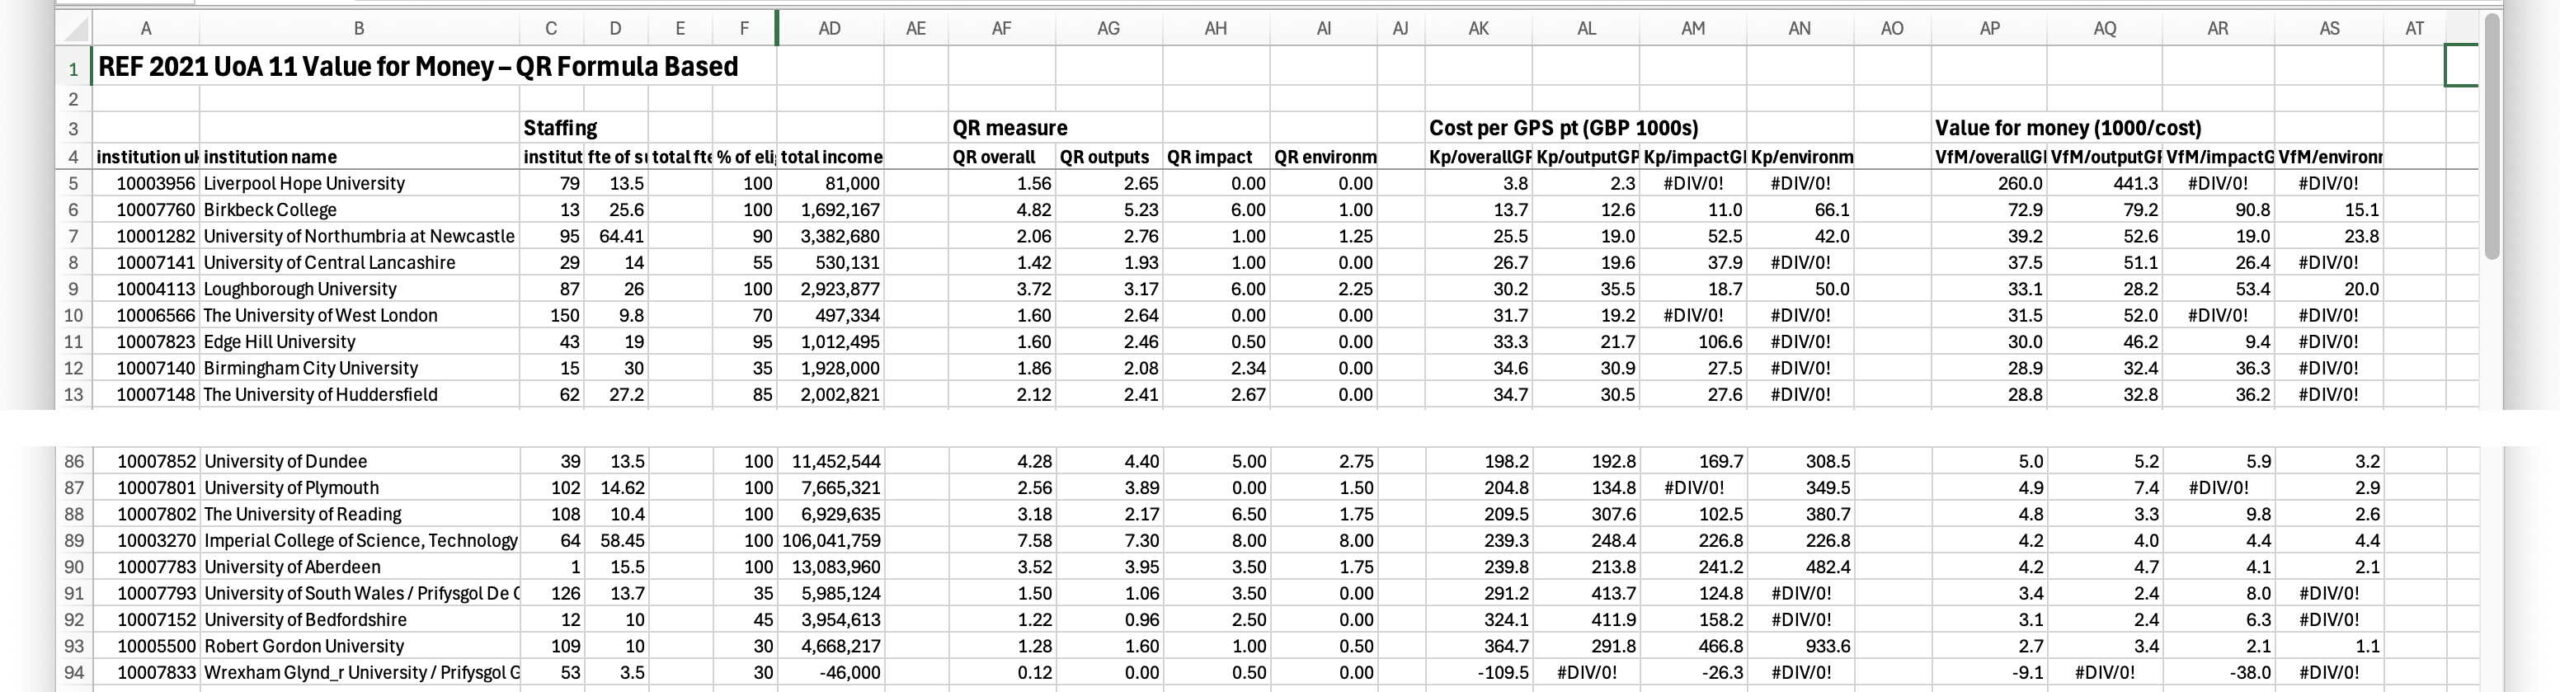
Fig 7. Ordered by QR–formula-weighting value for money (column AP)
The bottom of the table is a little more mixed, but the lower part is still dominated by research-intensive universities and only a few institutions bucking the trend. Of the Russell Group, only two get into the top quarter of the value for money table: Durham (slot 17) and Warwick (slot 23).
4.3 Four star output based orderings
As expected, if we focus entirely on 4* outputs, the same institutions dominate the top of the league table (Imperials, Oxford, Warwick), with post-1992 institutions at the bottom.
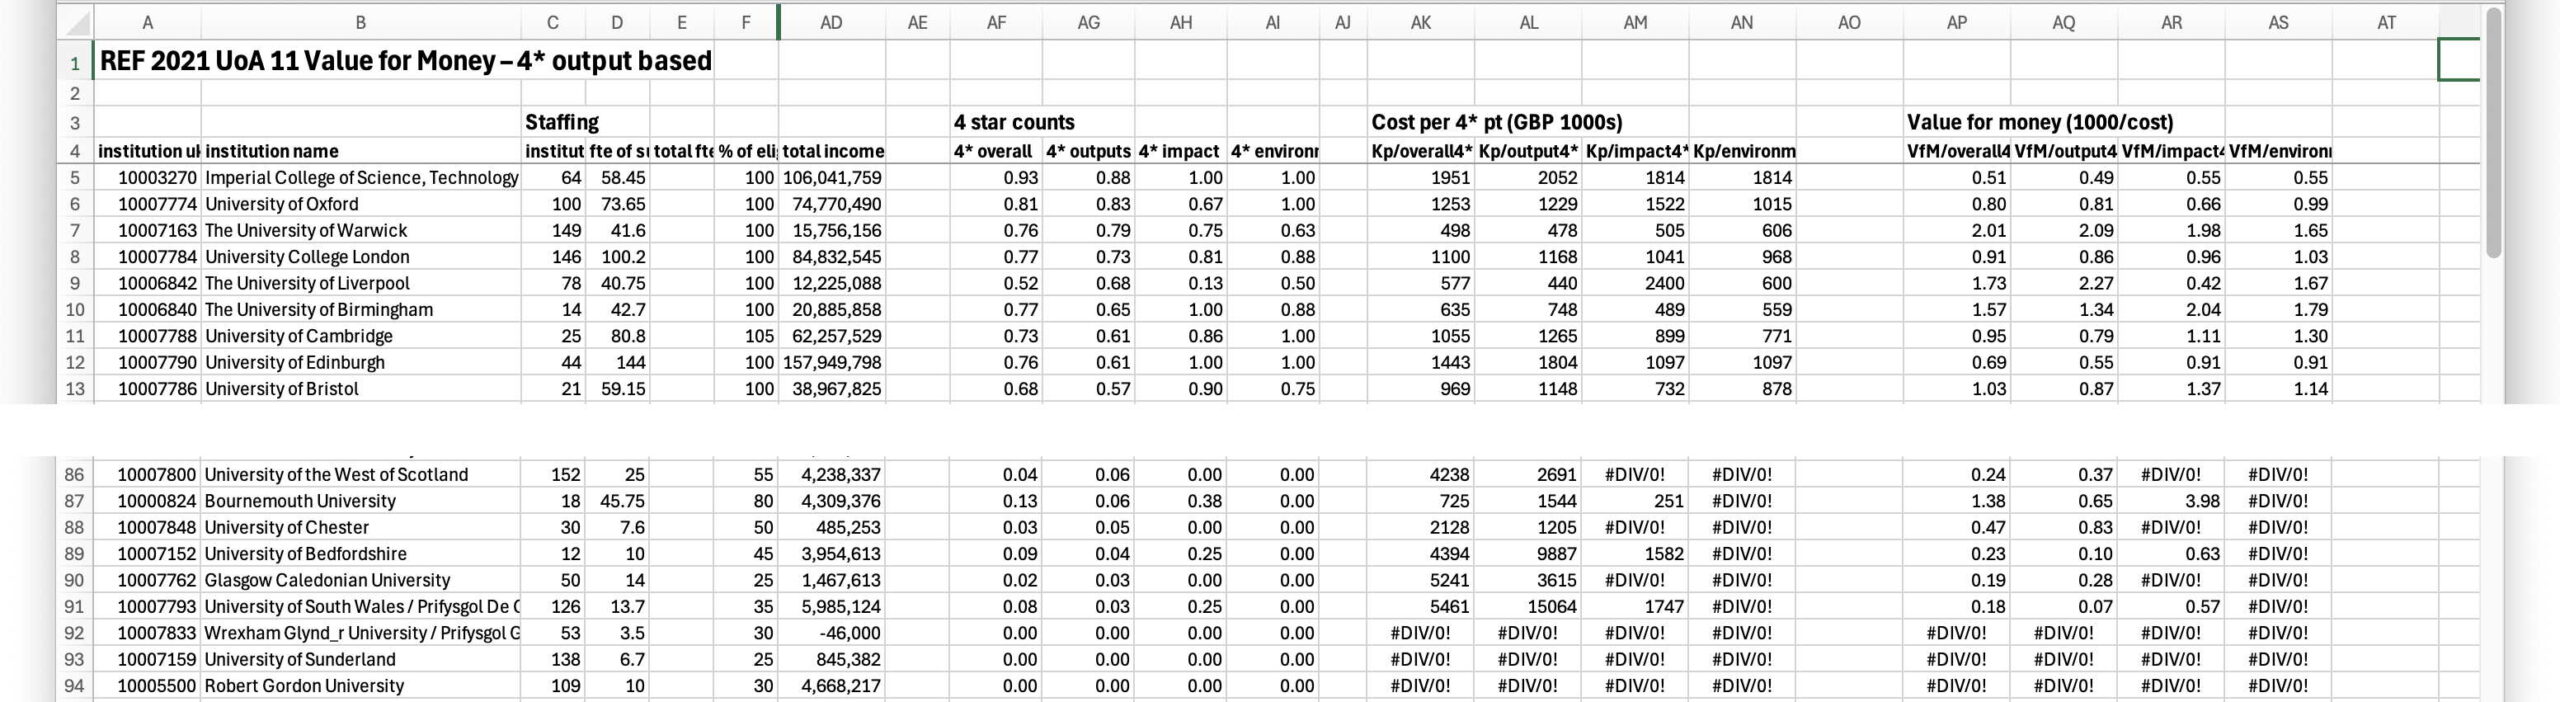
Fig 8. Ordered by 4* output volume (column AG)
Note that three, Wrexham, Sunderland and Robert Gordon have no 4* outputs in UoA11, which lead to anomalous results (Excel “#DIV/0!” error) in the value for money spreadsheet (Fig. 9). Ignoring these, post-1992 institutions again rank high (Liverpool Hope, Northumbria, etc.), with Birkbeck as an exception and this time other pre-1992 institutions in the top 10 with Universities of Liverpool, Kent and Warwick at positions 8, 9 and 10.
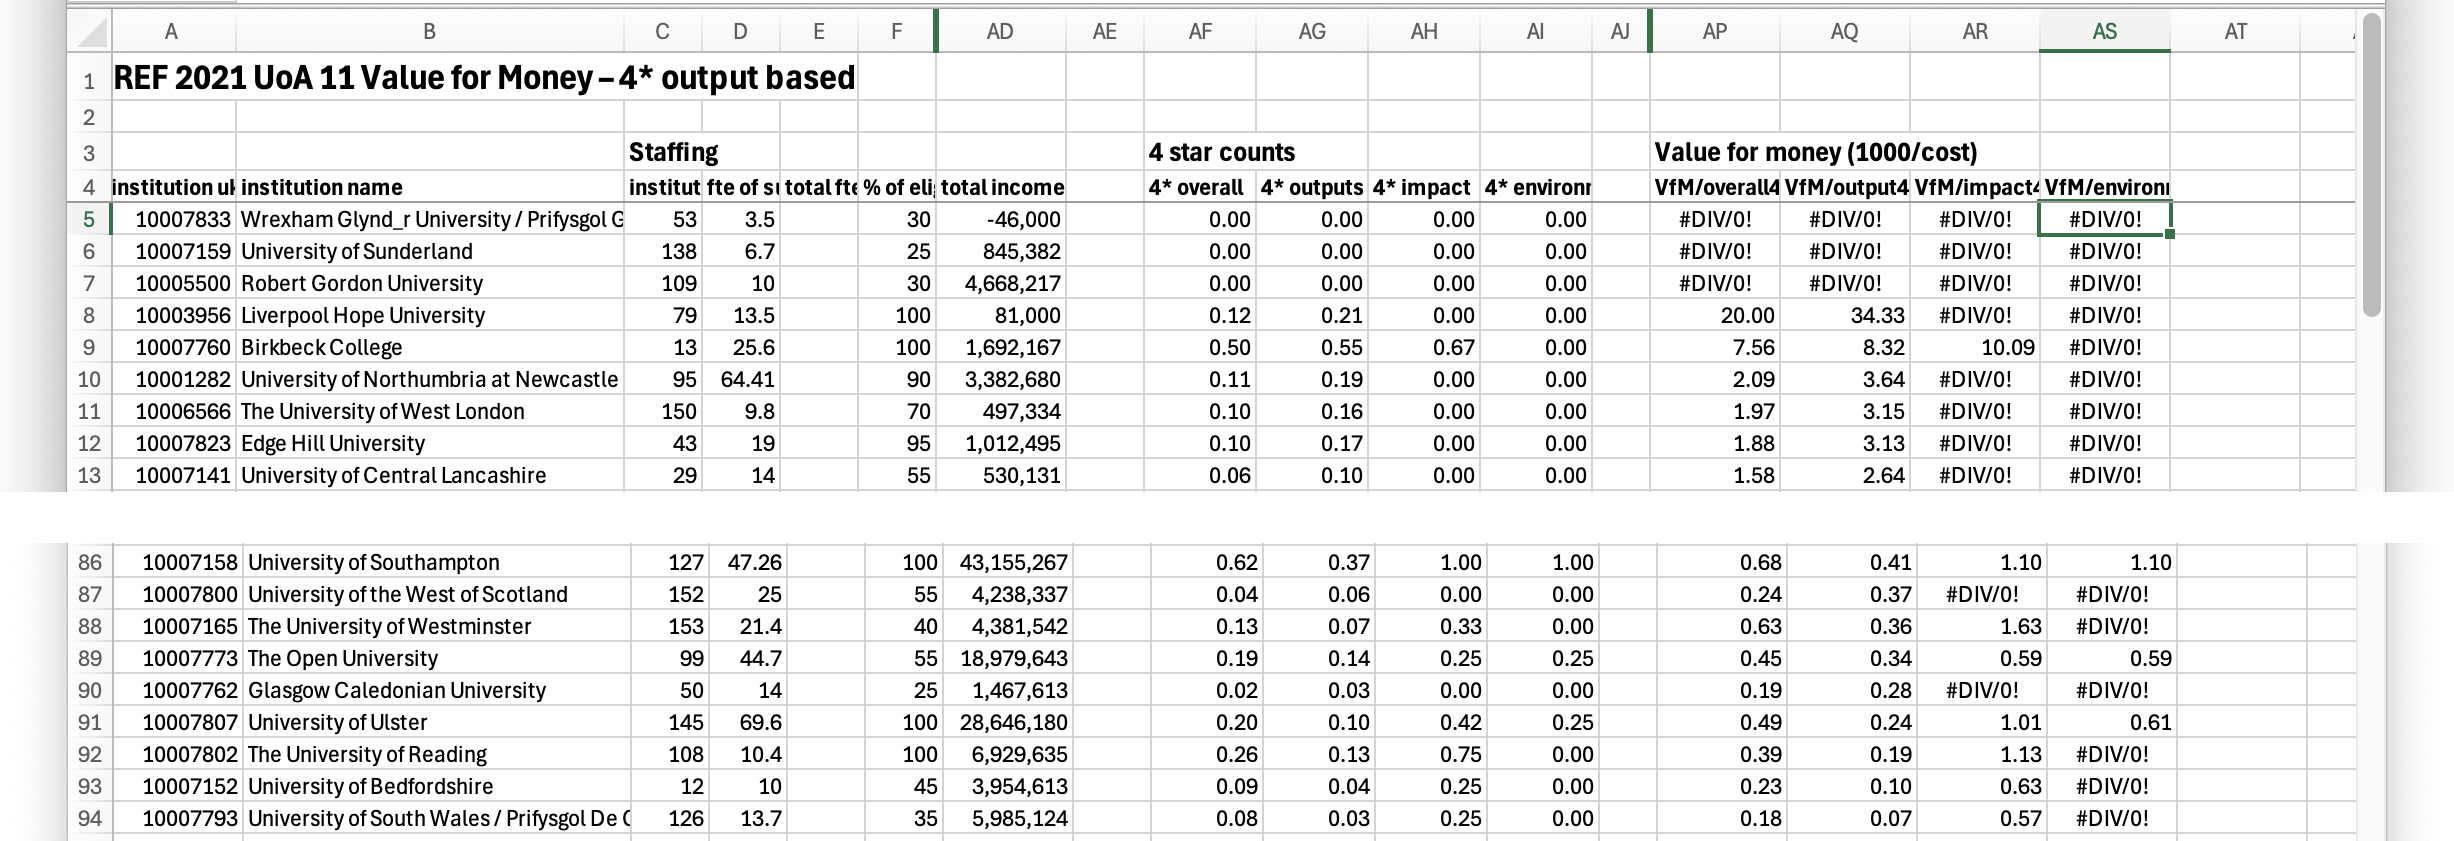
Fig 9. Ordered by 4* output volume value for money (column AQ)
The bottom of the table is also a little more mixed with Imperial managing about a quarter of the way up from the bottom and Oxford at around the half way point. Also, the overall ratio of value-for-money varies a little less across the table.
4.4 Result summary
In each case the results follow very similar trends. If one ranks by raw quality metrics then the well-known leaders are at the top, mostly Russell Group, with mainly post-a992 institutions towards the end if the table.
However, when we apply value-for-money measures the opposite trend is seen, with post-1992 institutions largely dominating the top of the value-for-money tables. One could argue that REF is about research excellence, and therefore metrics should focus most highly towards the 4* and 3* and the QR-formula weighted metric reflects this. Others would focus entirely on publications and impact within the research community (of course, this this is not the view of government, nor REF as a whole), and so the 4* outputs only measure focuses entirely on this. However, while this extreme picture is a little more mixed, even using this more heavily 4* and publication weighted measure, the overall value for money trends are still apparent.
It should be noted also that in my analysis of the REF2014 outcomes [Dx15b], it was clear that in UoA11, we had very strong implicit bias towards the more obvious institutions, tending on average to under-rate post-1992 institutions and over-rate Russell Group with respect to internationally normalised metrics. If the above analysis were repeated with, say, Scopus field-weighted citation data the results would be likely to be more extreme.