
This page contains details of how the data for the report was extracted from the official REF public domain data and then processed to create the summary spreadsheets. It is also included as an appendix of the main report.
Downloading data from the REF 2021 database
The spreadsheet of institution-by-institution results is accessed from the REF results and submissions database starting at the main page for the UoA results (Fig A1).
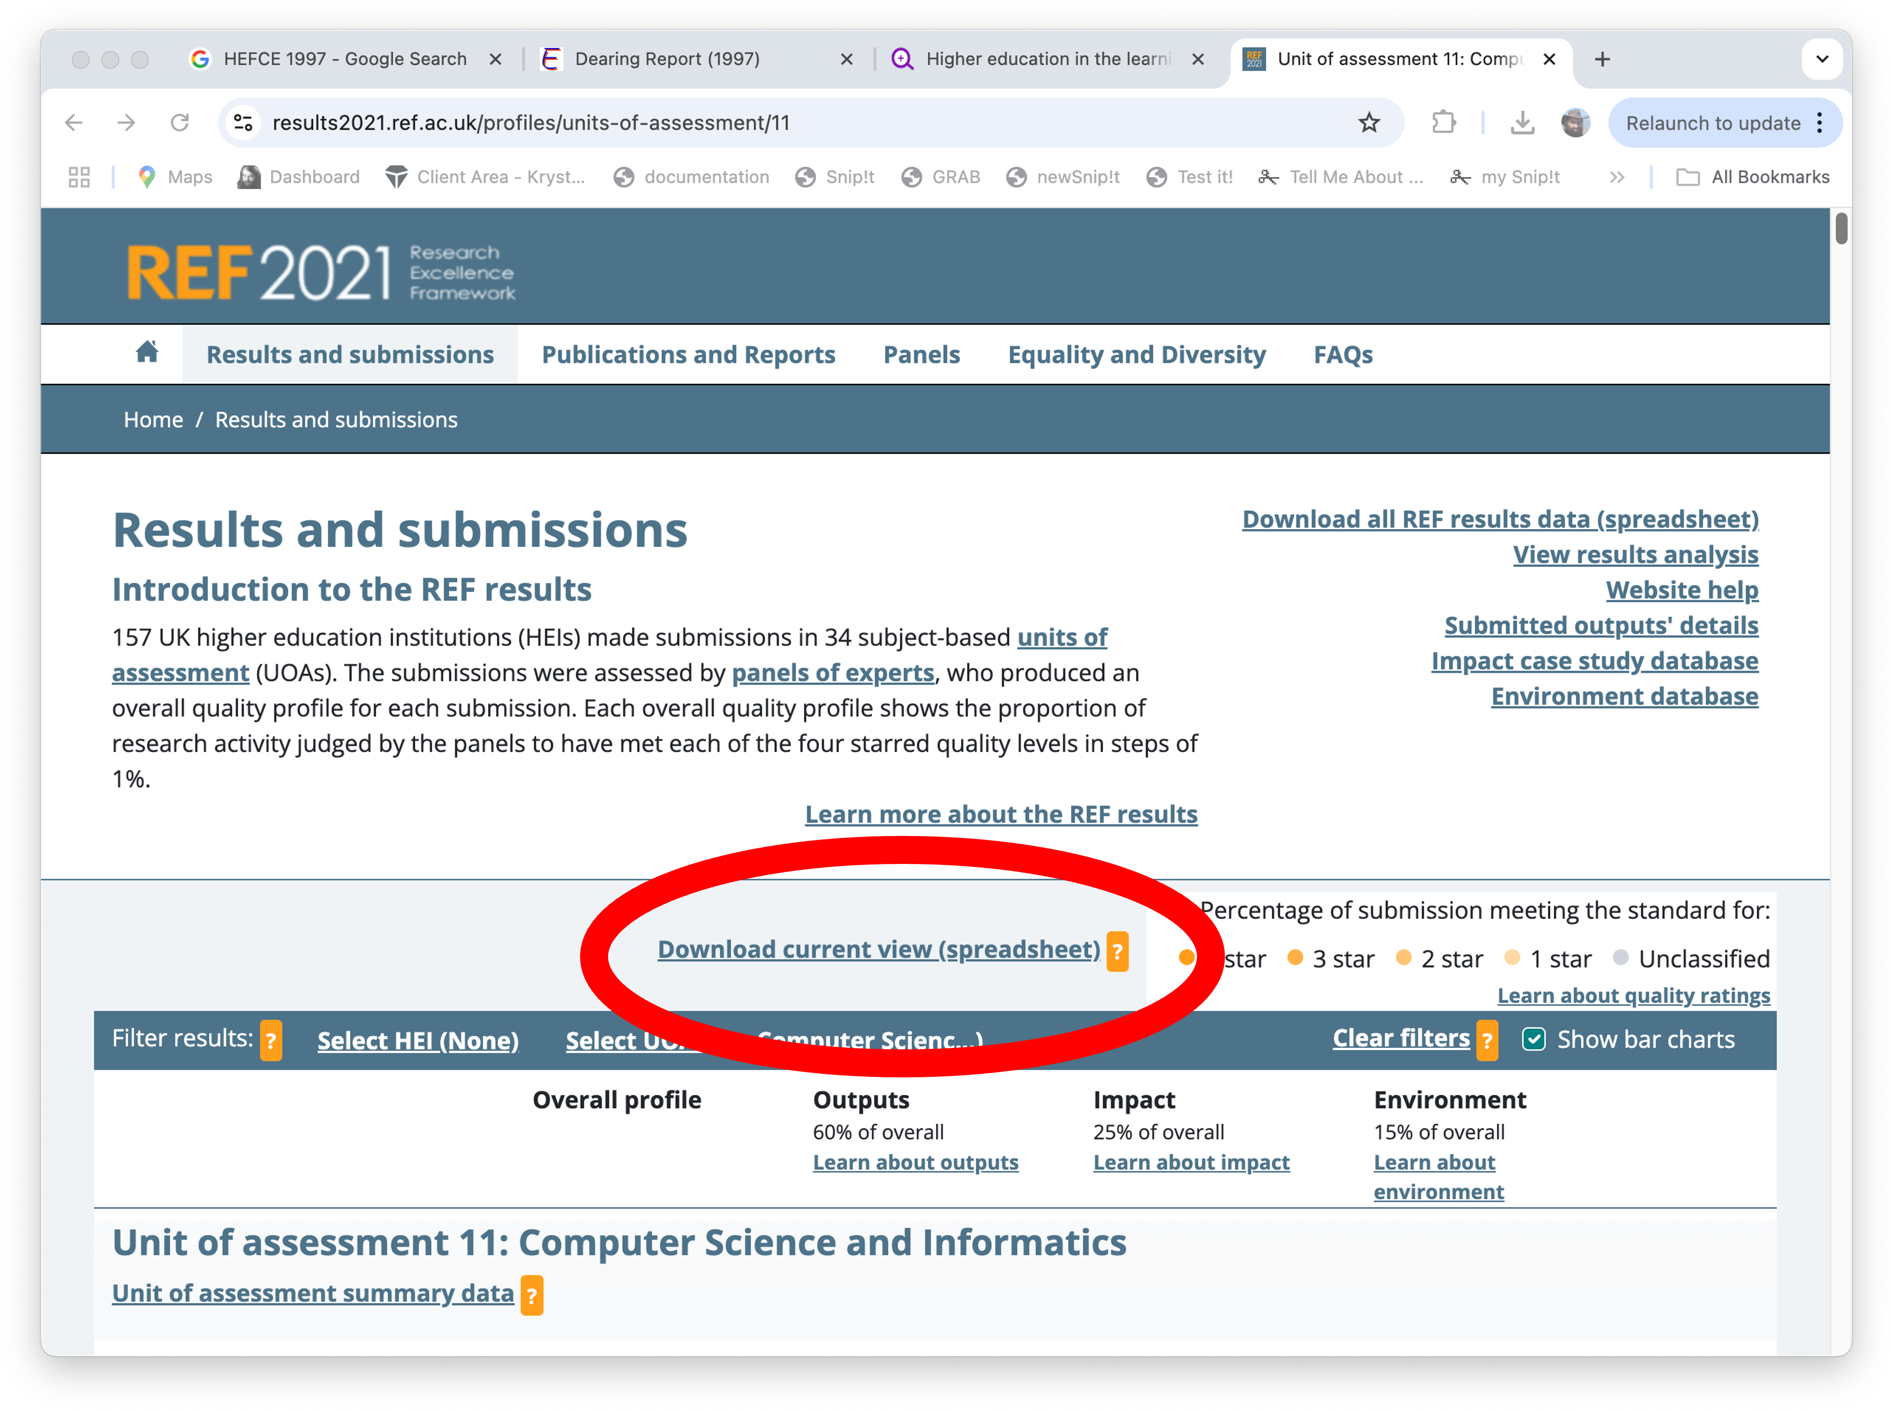
Fig A1. UoA11 main page – ‘Download current view’ creates spreadsheet of results
https://results2021.ref.ac.uk/profiles/units-of-assessment/11
This produces a spreadsheet with four rows for each institution listing a profile of 4*,3*, 2*, 1* and unclassified results for Overall, Outputs, Impact and Environments respectively (Fig. A2).
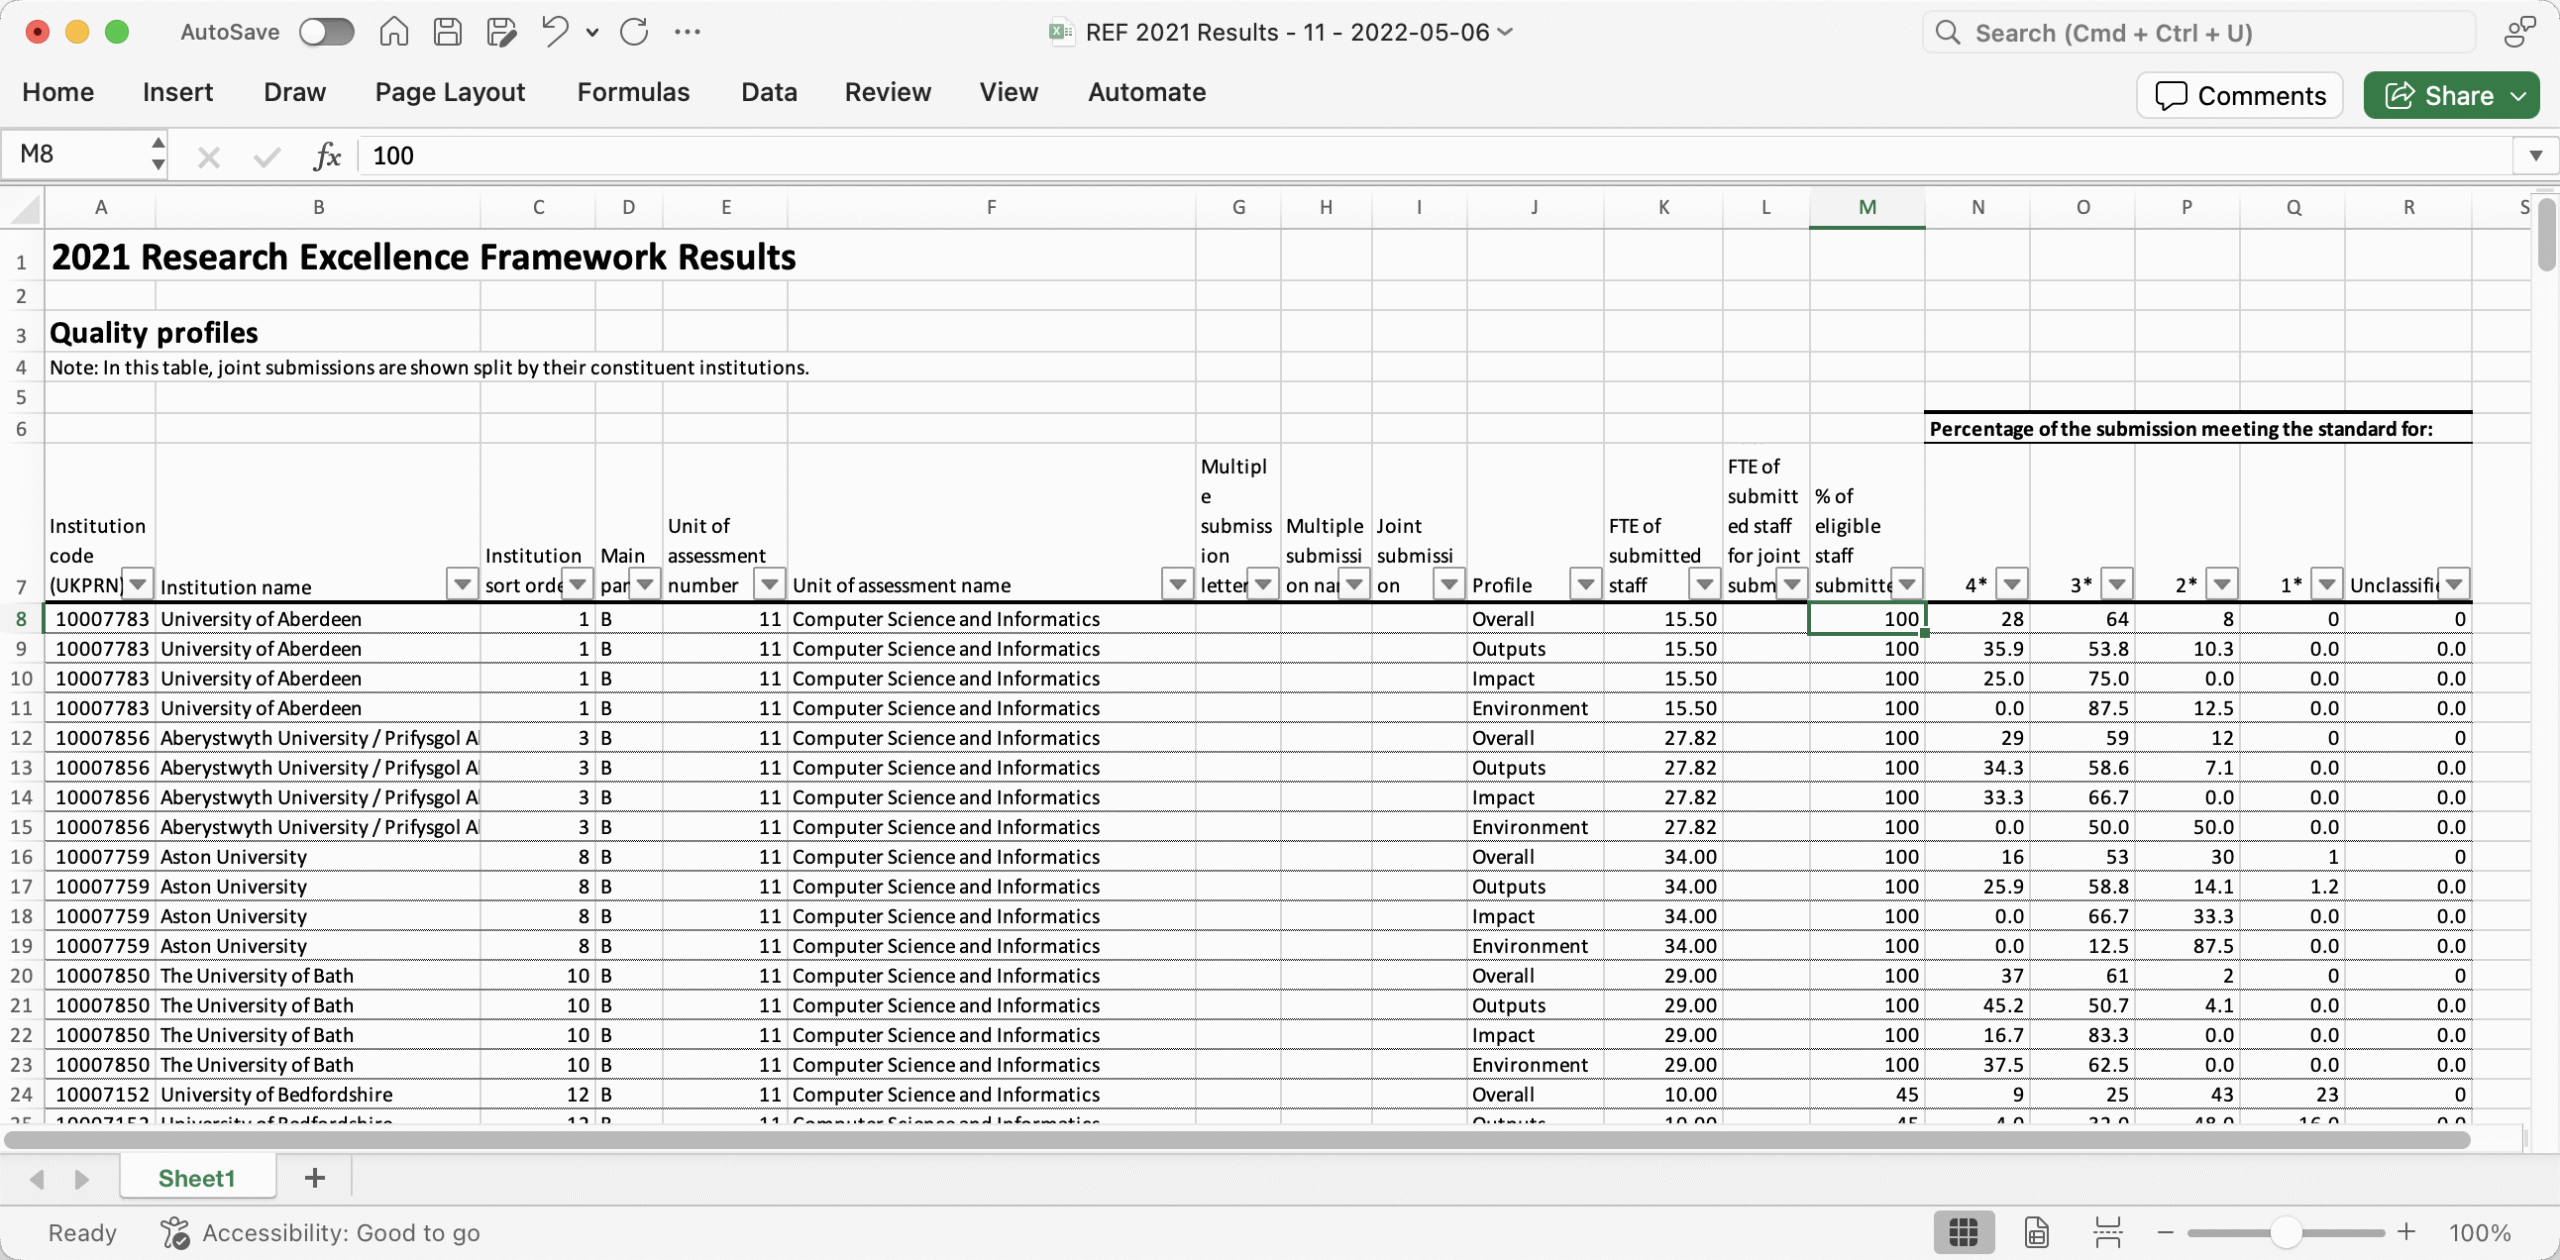
Fig A2. Quality Profiles Spreadsheet with separate rows for Overall, Outputs, Impact, and Environment
The income spreadsheets are accessed from the Environment submssions database (Fig. A3). One must first select the desired unit of assessment (UoA11 in the case of this report) and then navigate to the Downloads area.
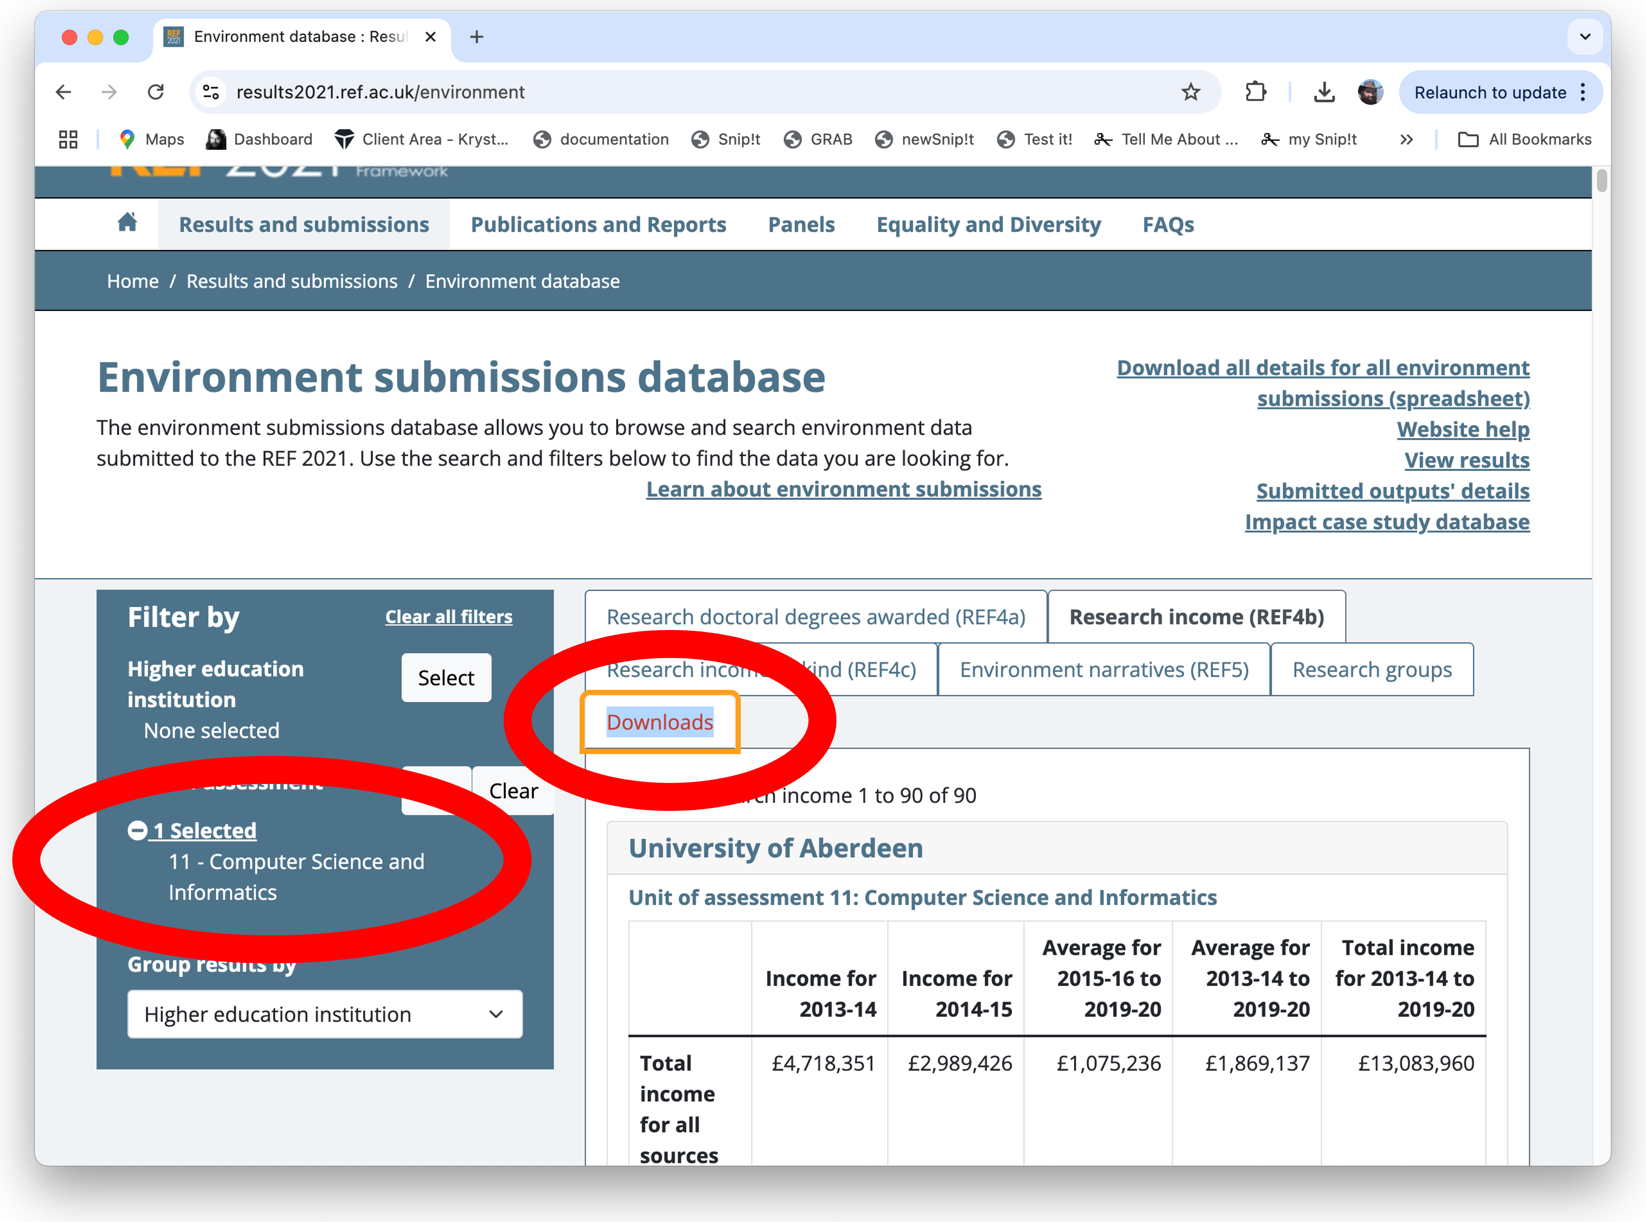
Fig A3. UoA11 main page – ‘Download current view’ creates spreadsheet of results
https://results2021.ref.ac.uk/environment
This then contains download links for the income and income-in-kind CSV files (Fig A4).
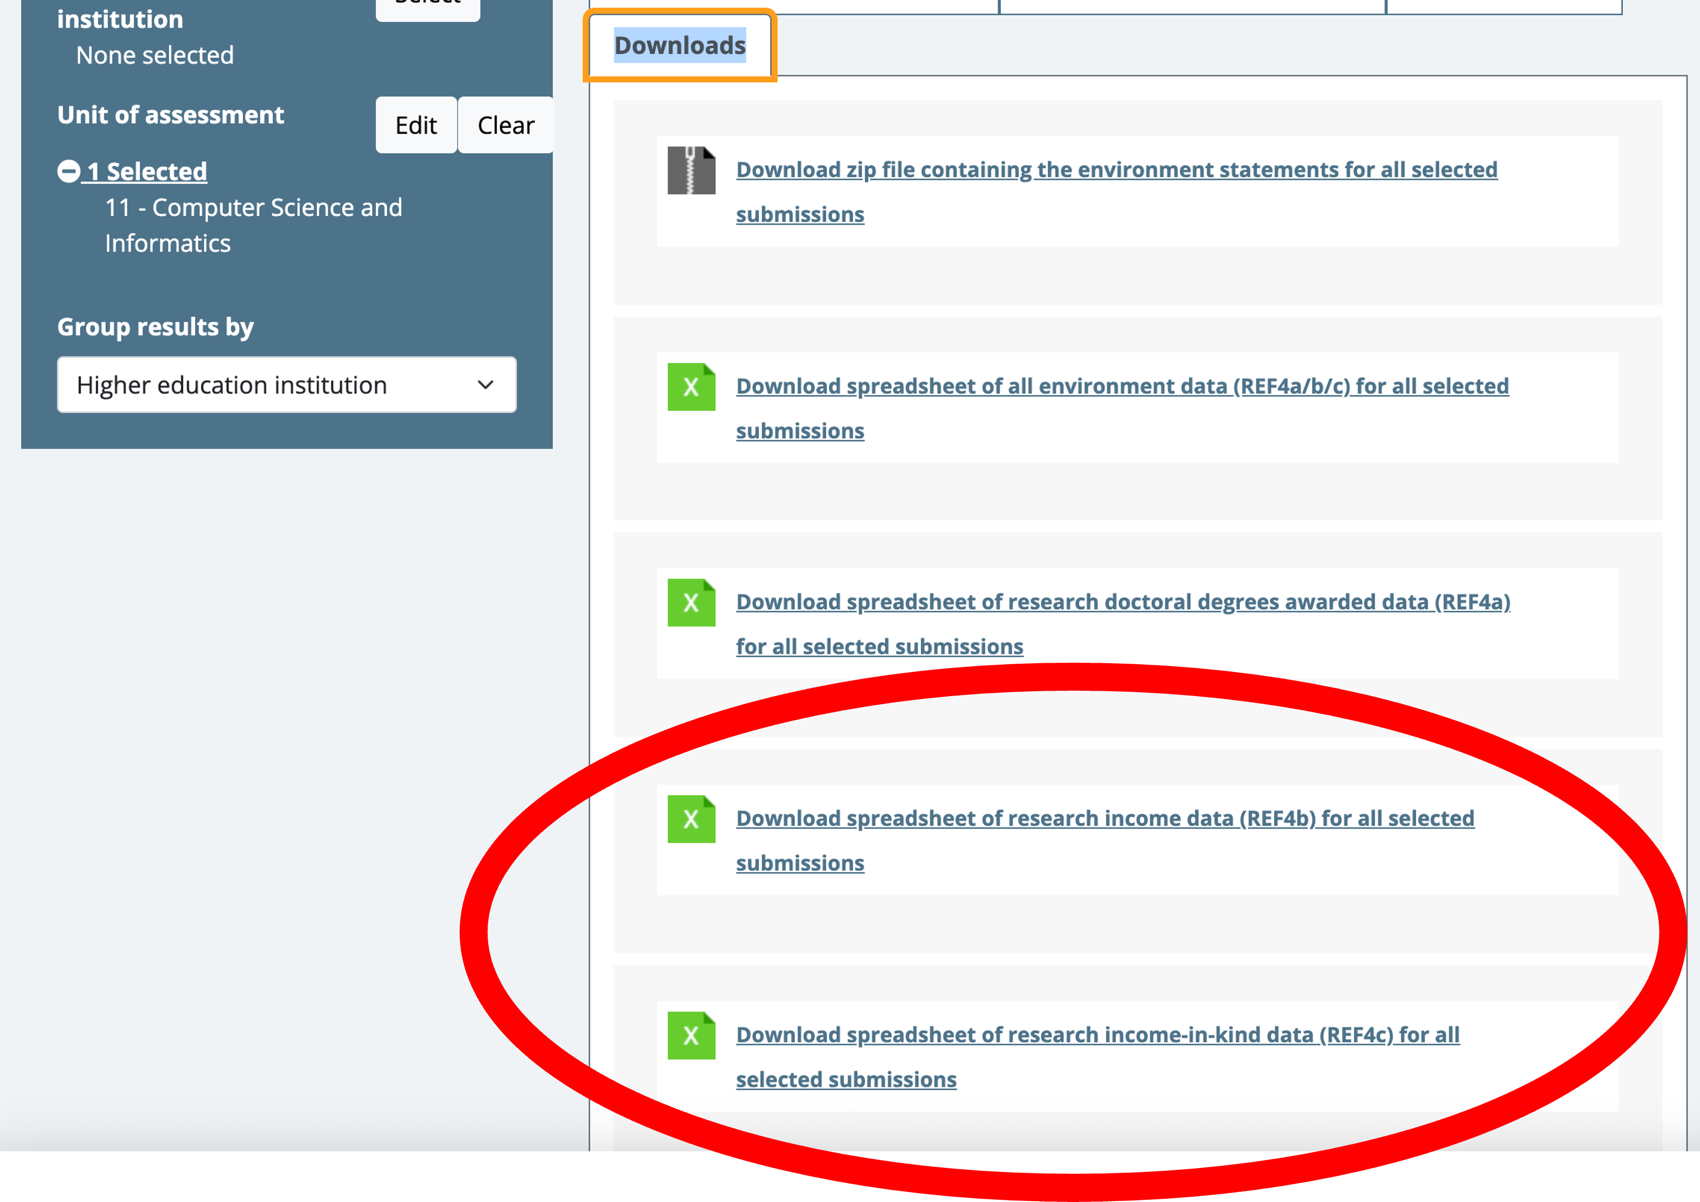
Fig A4. Downloads tab including income and income-in-kind CSV files
The income spreadsheet (Fig. A5) covers 14 different types of income and a overall income total each on a separate row with five columns each containing yearly averages and overall totals covering different time periods.
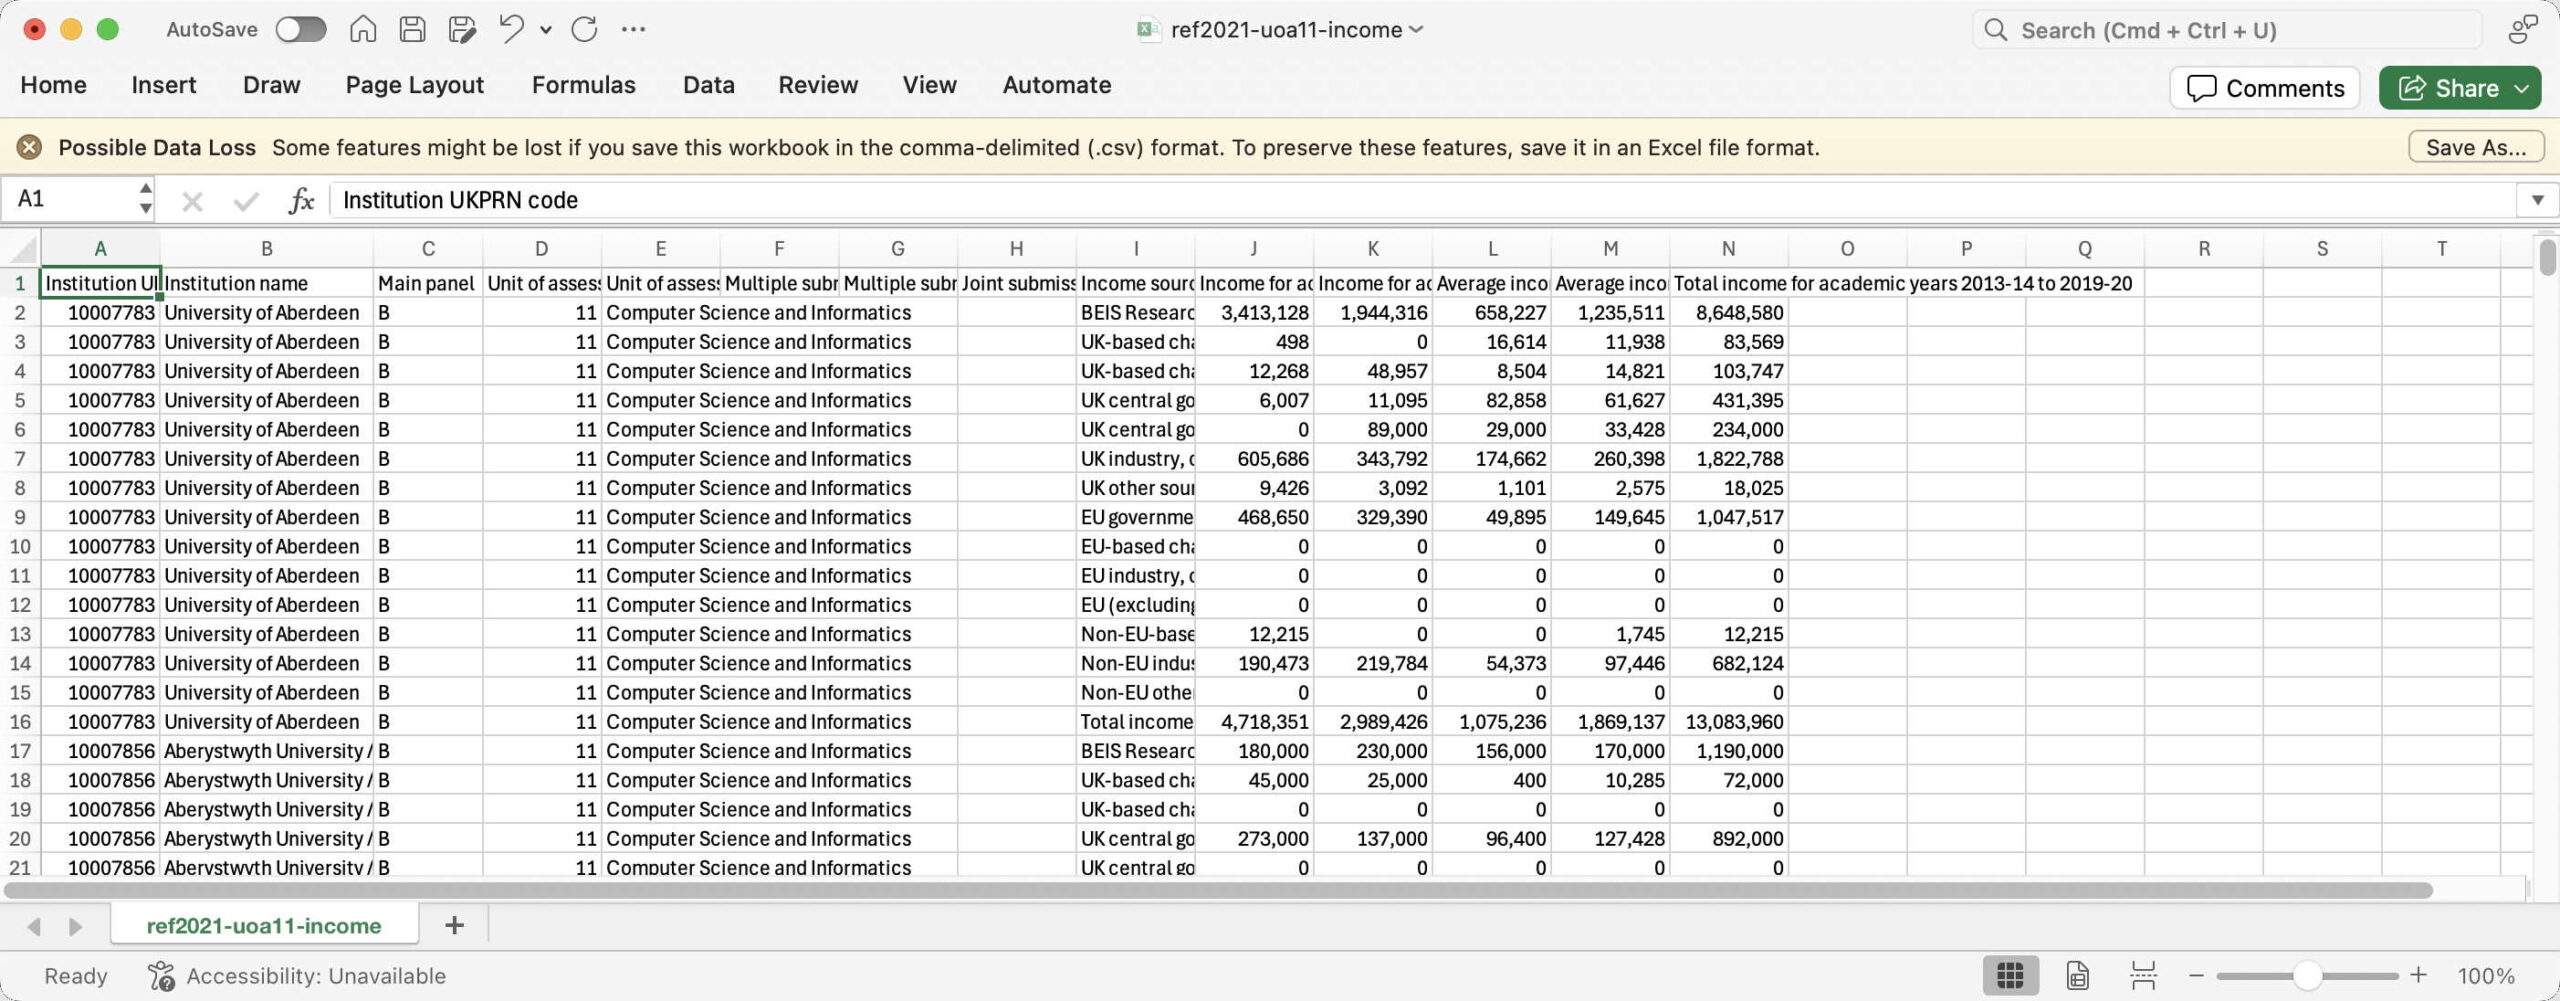
Fig A5. Income Spreadsheet with separate rows for fourteen categories and overall total
Local Processing
The spreadsheets were processed by a small PHP script to create a single JSON file with all the information gathered together for each institution [JSON DATA]. This was then run through a second script to extract a summary CSV with one row per institution (Fig. A6), which was then used to calculate the various metrics and tables [EXCEL DATA] All of the different outcomes profiles are included as separate columns, but only three of the income measures were included as there would have been 75 income totals plus a further eight research in kind columns.
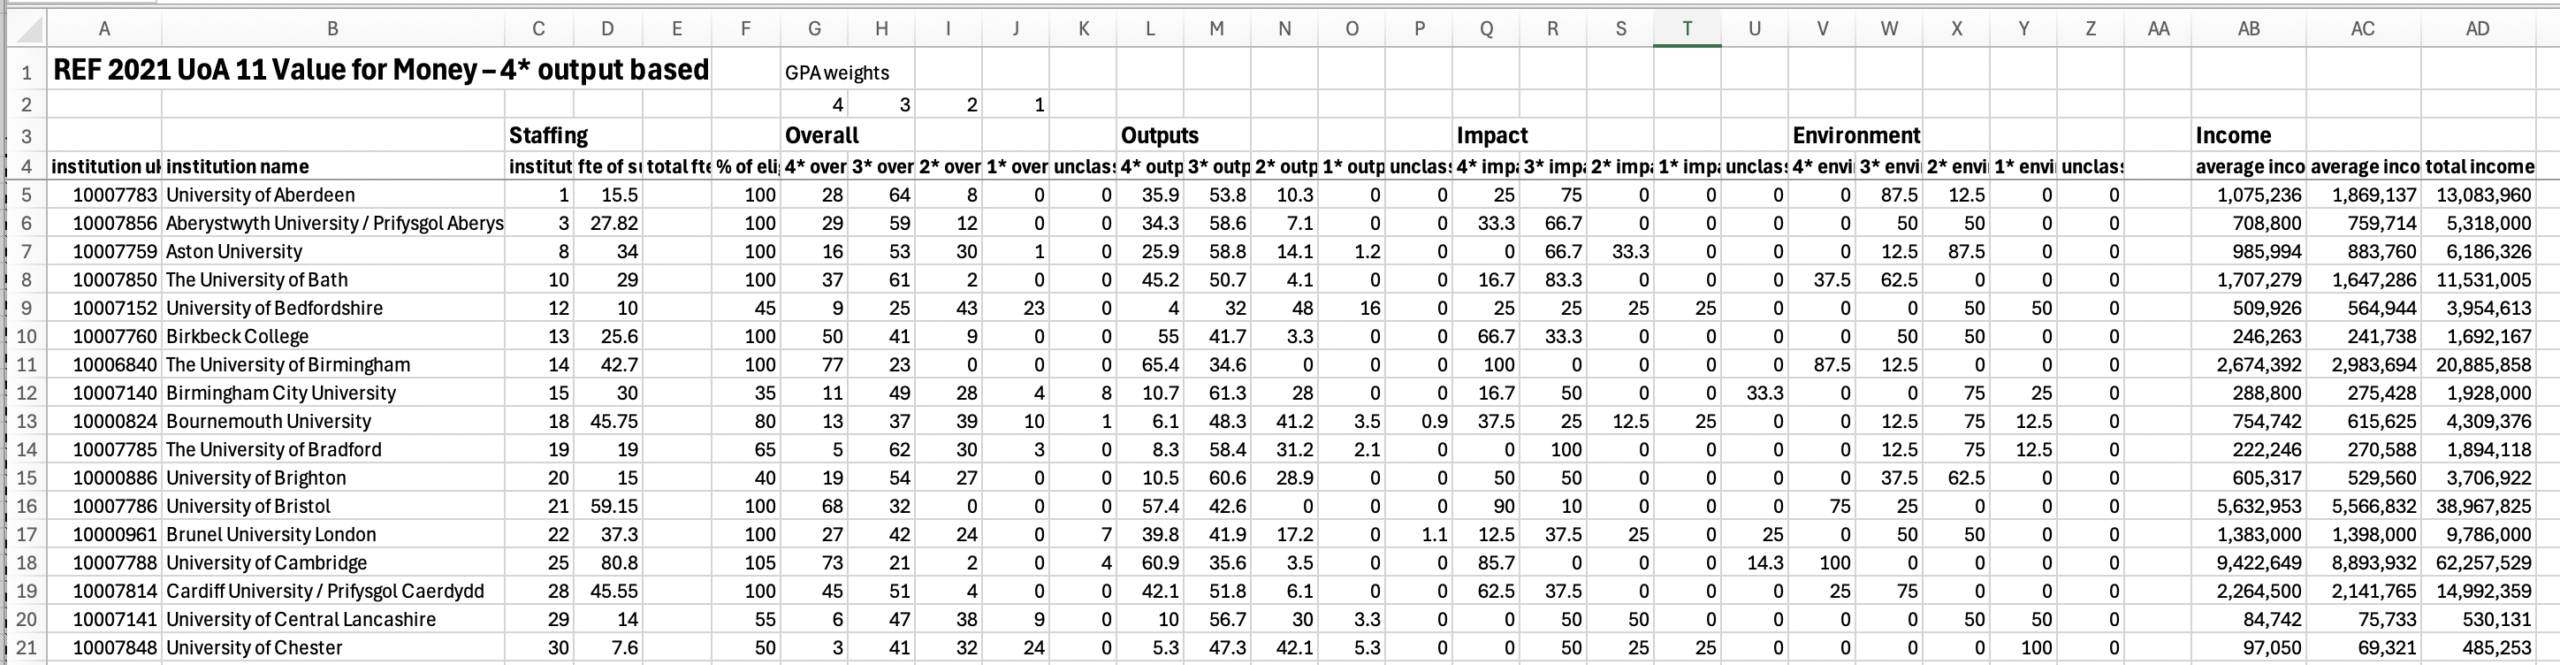
Fig A6. Combined Spreadsheet with separate columns for each type of profile
and small selection of income measures
[JSON DATA] https://alandix.com/data/REF2021/ref2021-uoa11.json
[EXCEL DATA] https://alandix.com/data/REF2021/summary-REF-FfM-UoA11-20250408.xlsx