
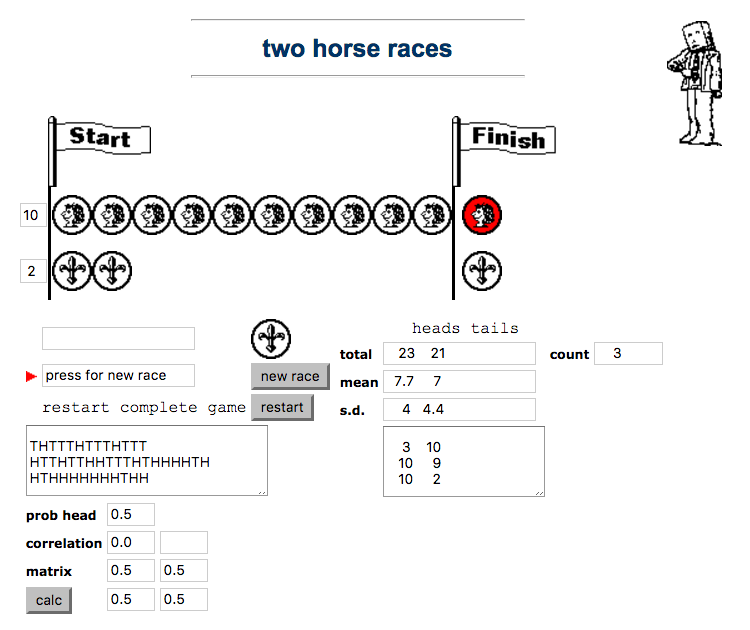
 |
Will it be heads or tails that make it to the line?
Experiment with biased coins and non-independent tosses. |
Documentation
The first application automates the two-horse races that you have done by hand with real coins in the “unexpected wildness of random” exercises. This happens in the `virtual race area’ marked in the image below.
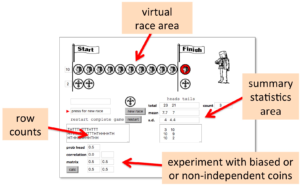
Virtual two horse races – main screen areas
So far this doesn’t give you any advantage over physical coin tossing unless you find tossing coins very hard. However, because the coins are virtual, the application is able to automatically keep a tally of all the coin tosses (in the “row counts” area), and then gather statistics about them (in the “summary statistics area”).
Perhaps most interesting is the area marked “experiment with biased or non-independent coins” as this allows you to create virtual coins that would be very hard to replicate physically.
We’ll start with the virtual race area (below). It should initially be empty. Press the coin icon (1) to toss a virtual coin. It will spin and when it stops the coin will be added to the top row for heads or the lower row for tails (2). Press the coin again for the next toss until one side or other wins. If you would like another go, just press the `new race’ button (3).
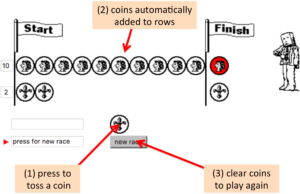
Virtual two horse races — race area detail
As you do each race you will see the coins also appear as `H’ and `T’ in the text area on the left below the coin toss button and the counts for each completed race appear in the text box to the right of that (below). The area above that box on the right keeps a tally of the total number of heads and tails, the mean (arithmetic average) if heads and tails per race, and the standard deviation of each. We’ll look at these in more detail in `more coin tossing’ below.
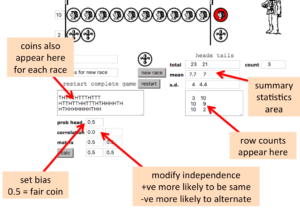
Virtual two horse races — row counts and summary statistics
Finally the area at the bottom left allows you to create unreal coins!
Adjusting the “prob head” allows you to create biased coins (valid values between 0 and 1). For example, setting `prob head” to 0.2 makes a coin that will fall heads 20\% of the time and tails 80\% of the time (both on average of course!).
Adjusting the `correlation’ figure allows you to create coins that depend on the previous coin toss (valid values -1 to +1). A positive figure means that each coin is more likely to be the same as the previous one — that is if the previous coin was a head you are more likely to also get a head on the next toss. This is a bit like a learning effect in a user experiment. Putting a negative value does the opposite, if the previous toss was a head the next one is more likely to be tail.
Play with these values to get a feel for how it affects the coin tossing. However, do remember to do plenty of coin tosses for each setting otherwise all you will see is the randomness! Play first with quite extreme values, as this will be more evident.