
Videos
The of videos at https://hcibook.net/gen/HCIstats2017/
Live Demos
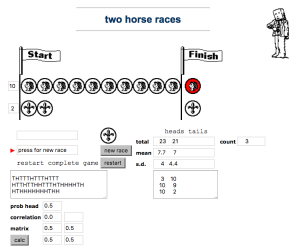 |
Two Horse Races
Will it be heads or tails that make it to the line? Experiment with biased coins and non-independent tosses. |
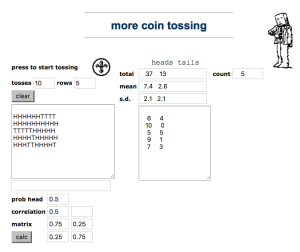 |
More Coin Tossing
More substantial tossing experiments with virtual coins. |
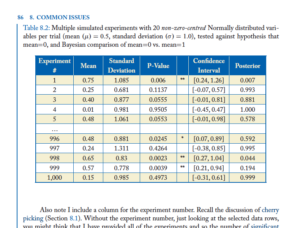 |
Data from simulated experiments used in section 8.3 Everything is Random, page 85-87.
As: Google Spreadsheet | Excel | OpenDoc |