All analysis has been performed on public-domain data.
REF submission data
Full data for all disciplines is available at:
http://results.ref.ac.uk/
Data for computing is available at “Download submission data: 11 – Computer Science and Informatics.”
http://results.ref.ac.uk/DownloadSubmissions/ByUoa/11
Downloadable files include an Access database and two zip files each containing a spreadsheet listing outputs, staff, and other metadata and full copies of all environment templates, impact templates and impact case studies. They vary slightly:
Microsoft Excel 2007 spreadsheet for browsing (75.4MB): The spreadsheet has easily sortable columns and human readable column names, but only has a selection of the columns in the full data.
Normalised Microsoft Excel 2007 spreadsheet (76.9MB): The spreadsheet has all columns and the zip file also includes documentation as web pages.
REF Contextual Data
This spreadsheet was distributed by the REF team to institutions prior to submission in 2013, and its purpose and derivation is described in detail at:
http://www.ref.ac.uk/about/guidance/citationdata/contextualdata/
data at https://www.hesa.ac.uk/news/18-12-2014/research-excellence-framework-data
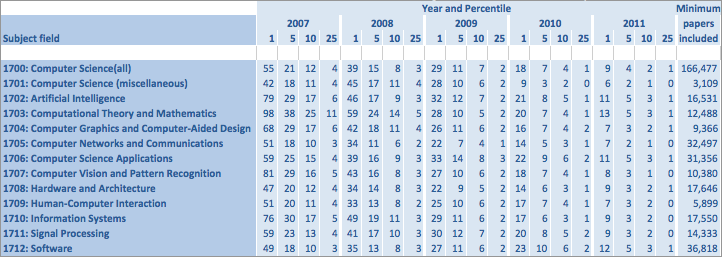
“Citation counts depend partly on the field of research and a publication’s age. Therefore, where sub-panels are making use of citation data the REF team will provide contextual data to assist in the sub-panel’s interpretation of the citation counts. This will consist of information about the citation behaviour of groups of papers worldwide, published in a similar subject area and of a similar age.” (extract)
This used data from Scopus to give a profile for each area. For each area and age of publication it gives the number of citations required to put the paper in the top 1%, 5%, 10% or 25% of papers within its area.
The full spreadsheet covers all academic areas, but the computing topics are reproduced in this excerpt.
Morris Sloman’s Sub-panel 11 Computer-Science and Informatics REF Analysis
This has been widely distributed and a copy is here.
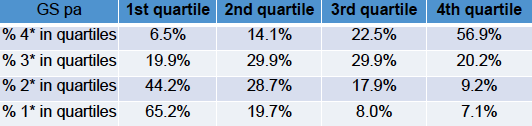
Some highlights (click for full size) …
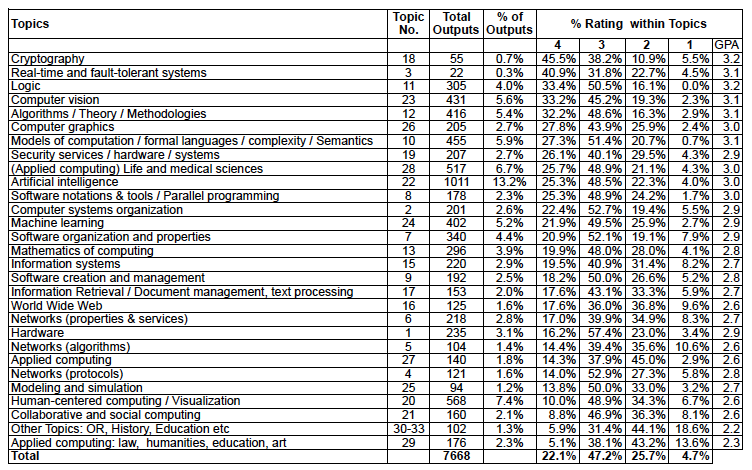
Table with 4*/3*/2*/1* profile for each sub-sea of computing using the ACM codes provided as part of the submission.
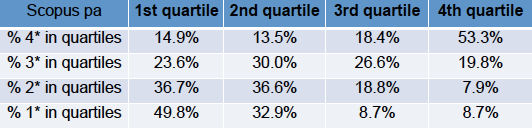
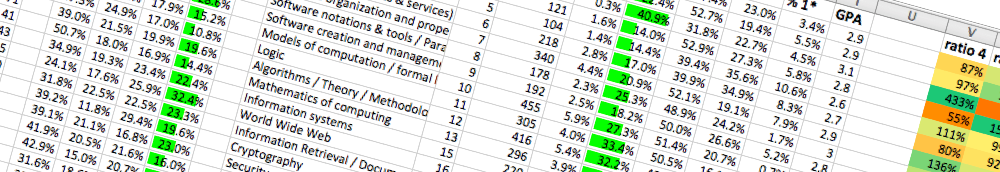
Cross tabulation of Scopus citation counts and REF scores.
The same for Google scholar citations
Derived data
The following of CSV and JSON files contain data derived from the raw REF submission data.
outputs.csv — The outputs worksheet from “Normalised Microsoft Excel 2007” exported as a CSV file. The fields are described in the REF documentation. Note that the ‘AdditionalInformation’ field includes a digit in angle brackets (e.g. “<23> This work proposes a method …”), which is the ACM topic code. Note too the column ‘CitedByCount’, which contains the Scopus citations for the output (at census date in last 2013)
outputs_with_google.csv — Copy of the above with two extra columns. ‘ACM_Code’ is the ACM code extracted from the ‘AdditionalInformation’ field. ‘Google_Cites’ is the google citations for the output where available (at census date late 2014)
outputs_with_google.json — The above in JSON format (often faster and easier to read than CSV).
g_outputs_with_scores.csv — Copy of outputs.csv with five extra columns. ‘ACM_Code’ is the ACM code as previously described. ‘Context_Code’ is the code from the REF contextual data. ‘Q_Score’ is a quartile score based on Scopus citations; high is best: 100 means top quartile, 25 bottom quartile and 50, and 75 and the middle quartiles. ‘C_Score’ is a score based on the REF contextual data; low is best: 1 means top 1% in its area worldwide, 5 top 5%, similar for 10, 25 and 100 means somewhere in the lower 75% of outputs. ‘G_Score’ is calculated the same as ‘Q_Score’, but using Google scholar citations. In each case a blank field means the data is unavailable.
g_outputs_with_scores.json — The above in JSON format.