making numbers meaningful
A news article says 35 thousand cubic metres of ice are melting from a glacier each year. It sounds a lot, but how much? Does it matter? TSoW is there to help readers and writers answer this. TSoW stands for “the size of Wales”, because, in the UK news, often the “size of Wales” or the “size of the Isle of Wight” are used to give people an idea of large areas.
Here’s a short video showing TSoW in action.
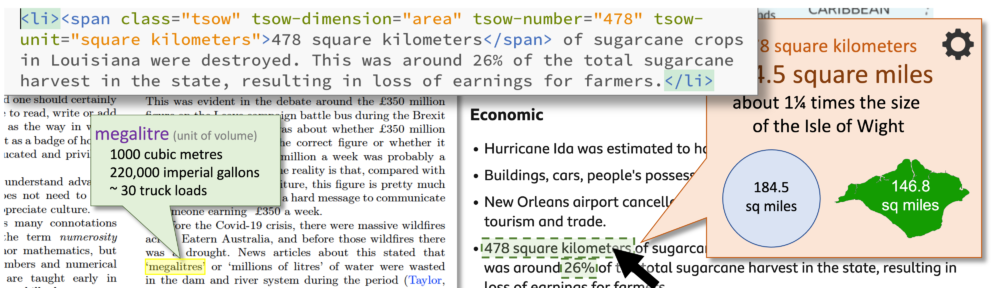
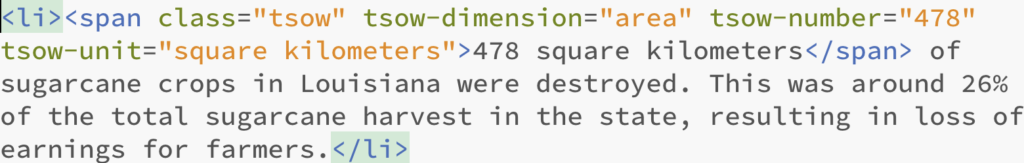
Some items on the web page have been marked up to show TSoW visualisations. This is done using standard HTML attributes.
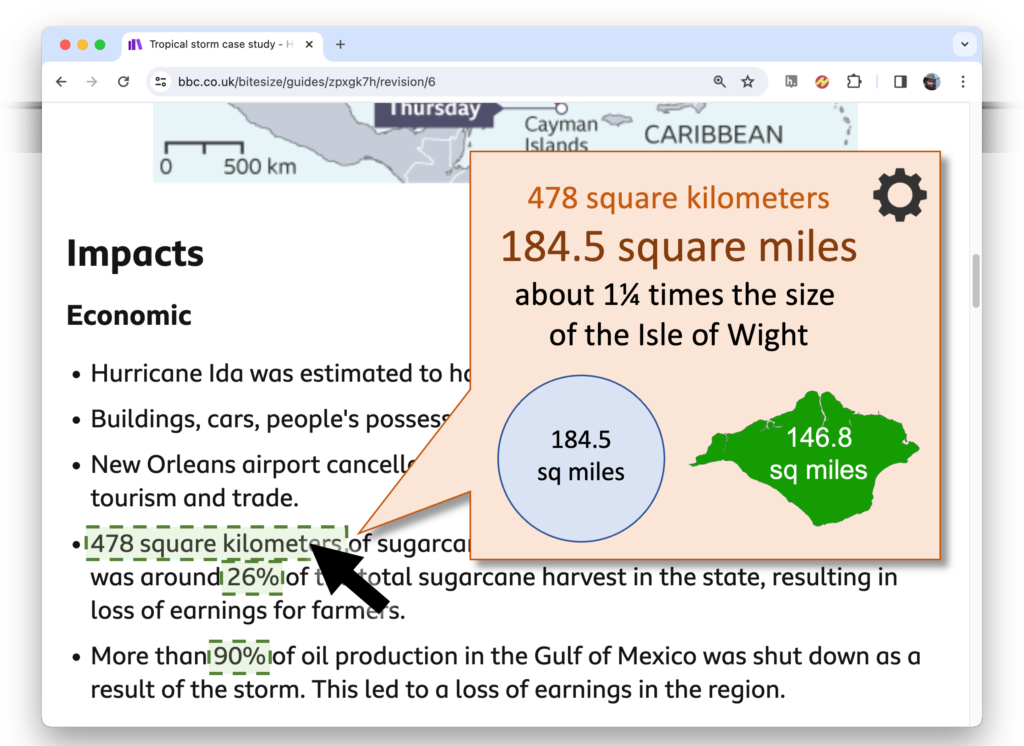
Then when a reader of the page hovers over the number a pop-up appears explaining the size in terms of units and comparisons that are meaningful to them
The current version has configurations for both UK and Italy, but this uses simple configuration tables so more local contexts can be added.
Why is it needed?
There are two reasons for TSoW. The first is for the readers of web pages. Sometimes explanations are written into the text of a page “wild fires now cover an area the size of Wales..”. However, if every number is explanation in this way, news articles would become too long, and possibly less comprehensible with so many explanations. TSoW adds these explanations on demand, but also allows the reader to choose local explanations that are more meaningful for them.
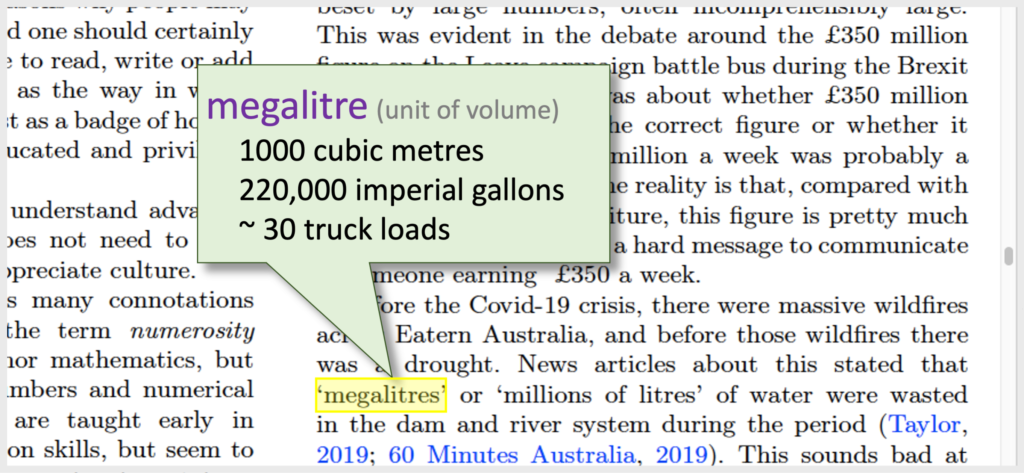
The second reason is to help the writers of information to avoid mistakes. For example, an Australian news piece once said that “megalitres” of water were being wasted one season from large river system. This sounds like a large amount, but actuall is obly about 30 truck loads of water, in relation to a large river not a lot ove a whole season. In fact the true figure was gigalitres of water, a thousand time’s greater. A BBC news article made an evan bigger gaff when describing ice loss from a Greenland glacier, with a figure one million times too small. If the author of the material sees the comparison, they can instantly see something is wrong.
Theory
TSoW is one of a series of tools for personal numerical information management including calQ and WS2. These are described in a short paper “Just Counting — a tool ecosystem for personal numeric information” at the AVI 2024 conference. This is in turn part of a wider research agenda looking at qualitative–quantitative reasoning, that is the qualitative understanding of quantitive phenomena. Think of that gut feeling you have that your change in a shop is too much or too little, or the way that you know turning a tap on more fills a bowl faster. This is essential in day-to-day life, but also form us all as we look at large scale issues such as the economy, climate change, and of course the Covid pandemic.
The design of TSoW was inspired by the use of “the size of …” in new articles. Yea-Seul et al.’s paper “Generating Personalized Spatial Analogies for Distances and Areas“, which covers very similar ground to TSoW, using a data detector to and also Chevalier et al’s “Using concrete scales: a practical framework for effective visual depiction of complex measures“.