beyond the spreadsheet
Spreadsheets are powerful and, compared with other methods of ‘programming’, a relatively easy way to do basic calculations. WS2 attempts to capture some of the low initial learning curve but also enables both more powerful uses and also ways to present results more clearly to others.
It is a work-in-progress and not fully usable at present, but you can have a go with some examples including:
- basic income – a calculator built into a WordPress page which allows you to experiment with different levels f basic income and see their affect on individuals and the economy as a whole
- SIR and SEIR models – the underlying methods used in much of the Covid-19 modelling.
Here’s a brief video showing you some of the features of WS2 in the basic income calculator.
WS2 in action – SIR model
We’ll use the SIR model to demonstrate some of the features of WS2. You can visit the web page and experiment yourself. The web page is shown below.
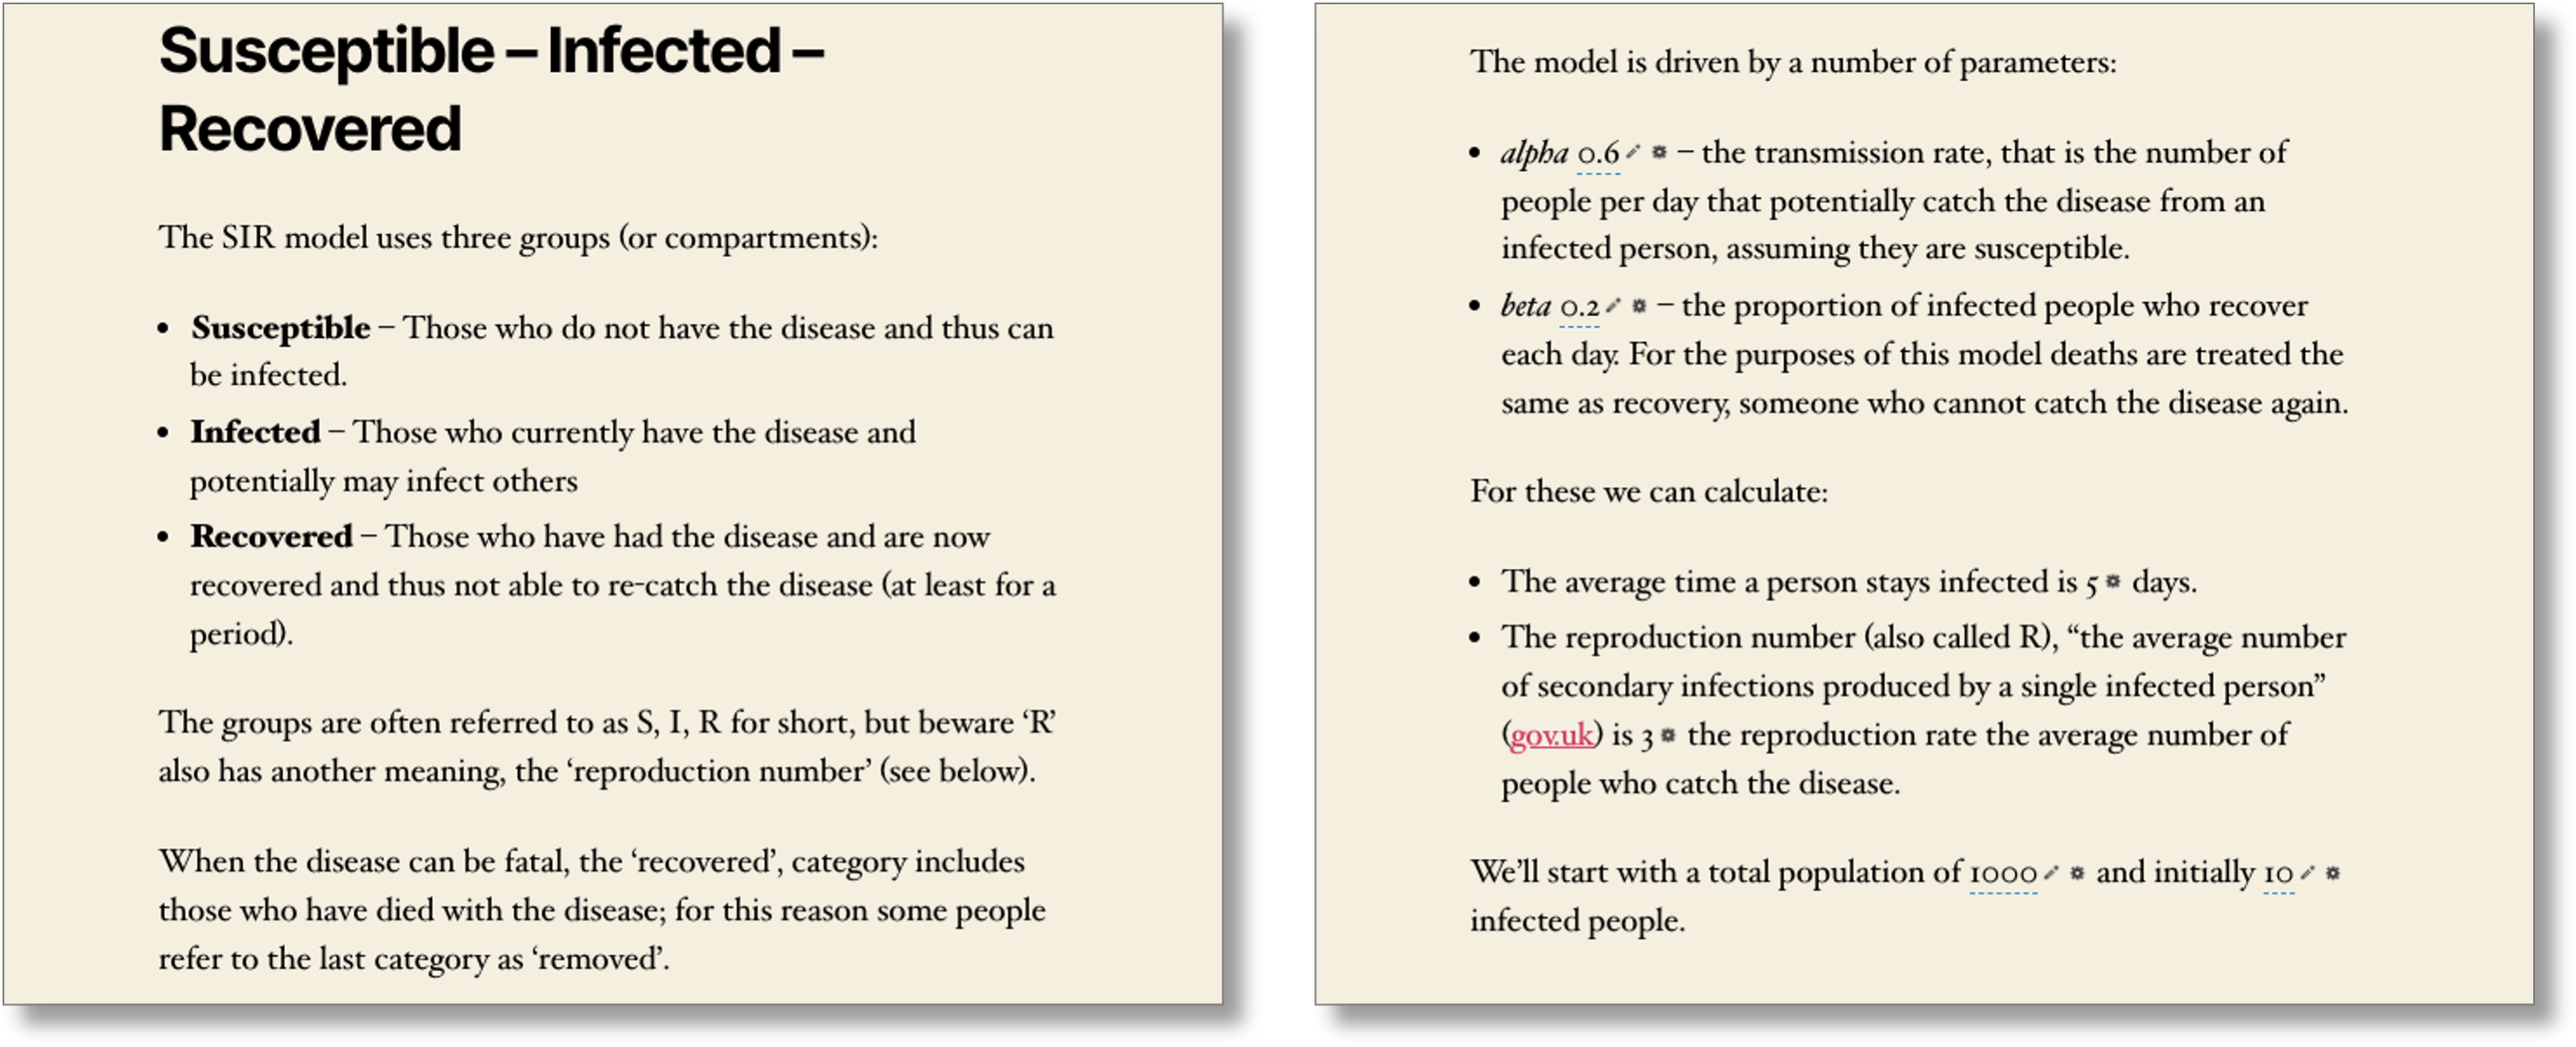
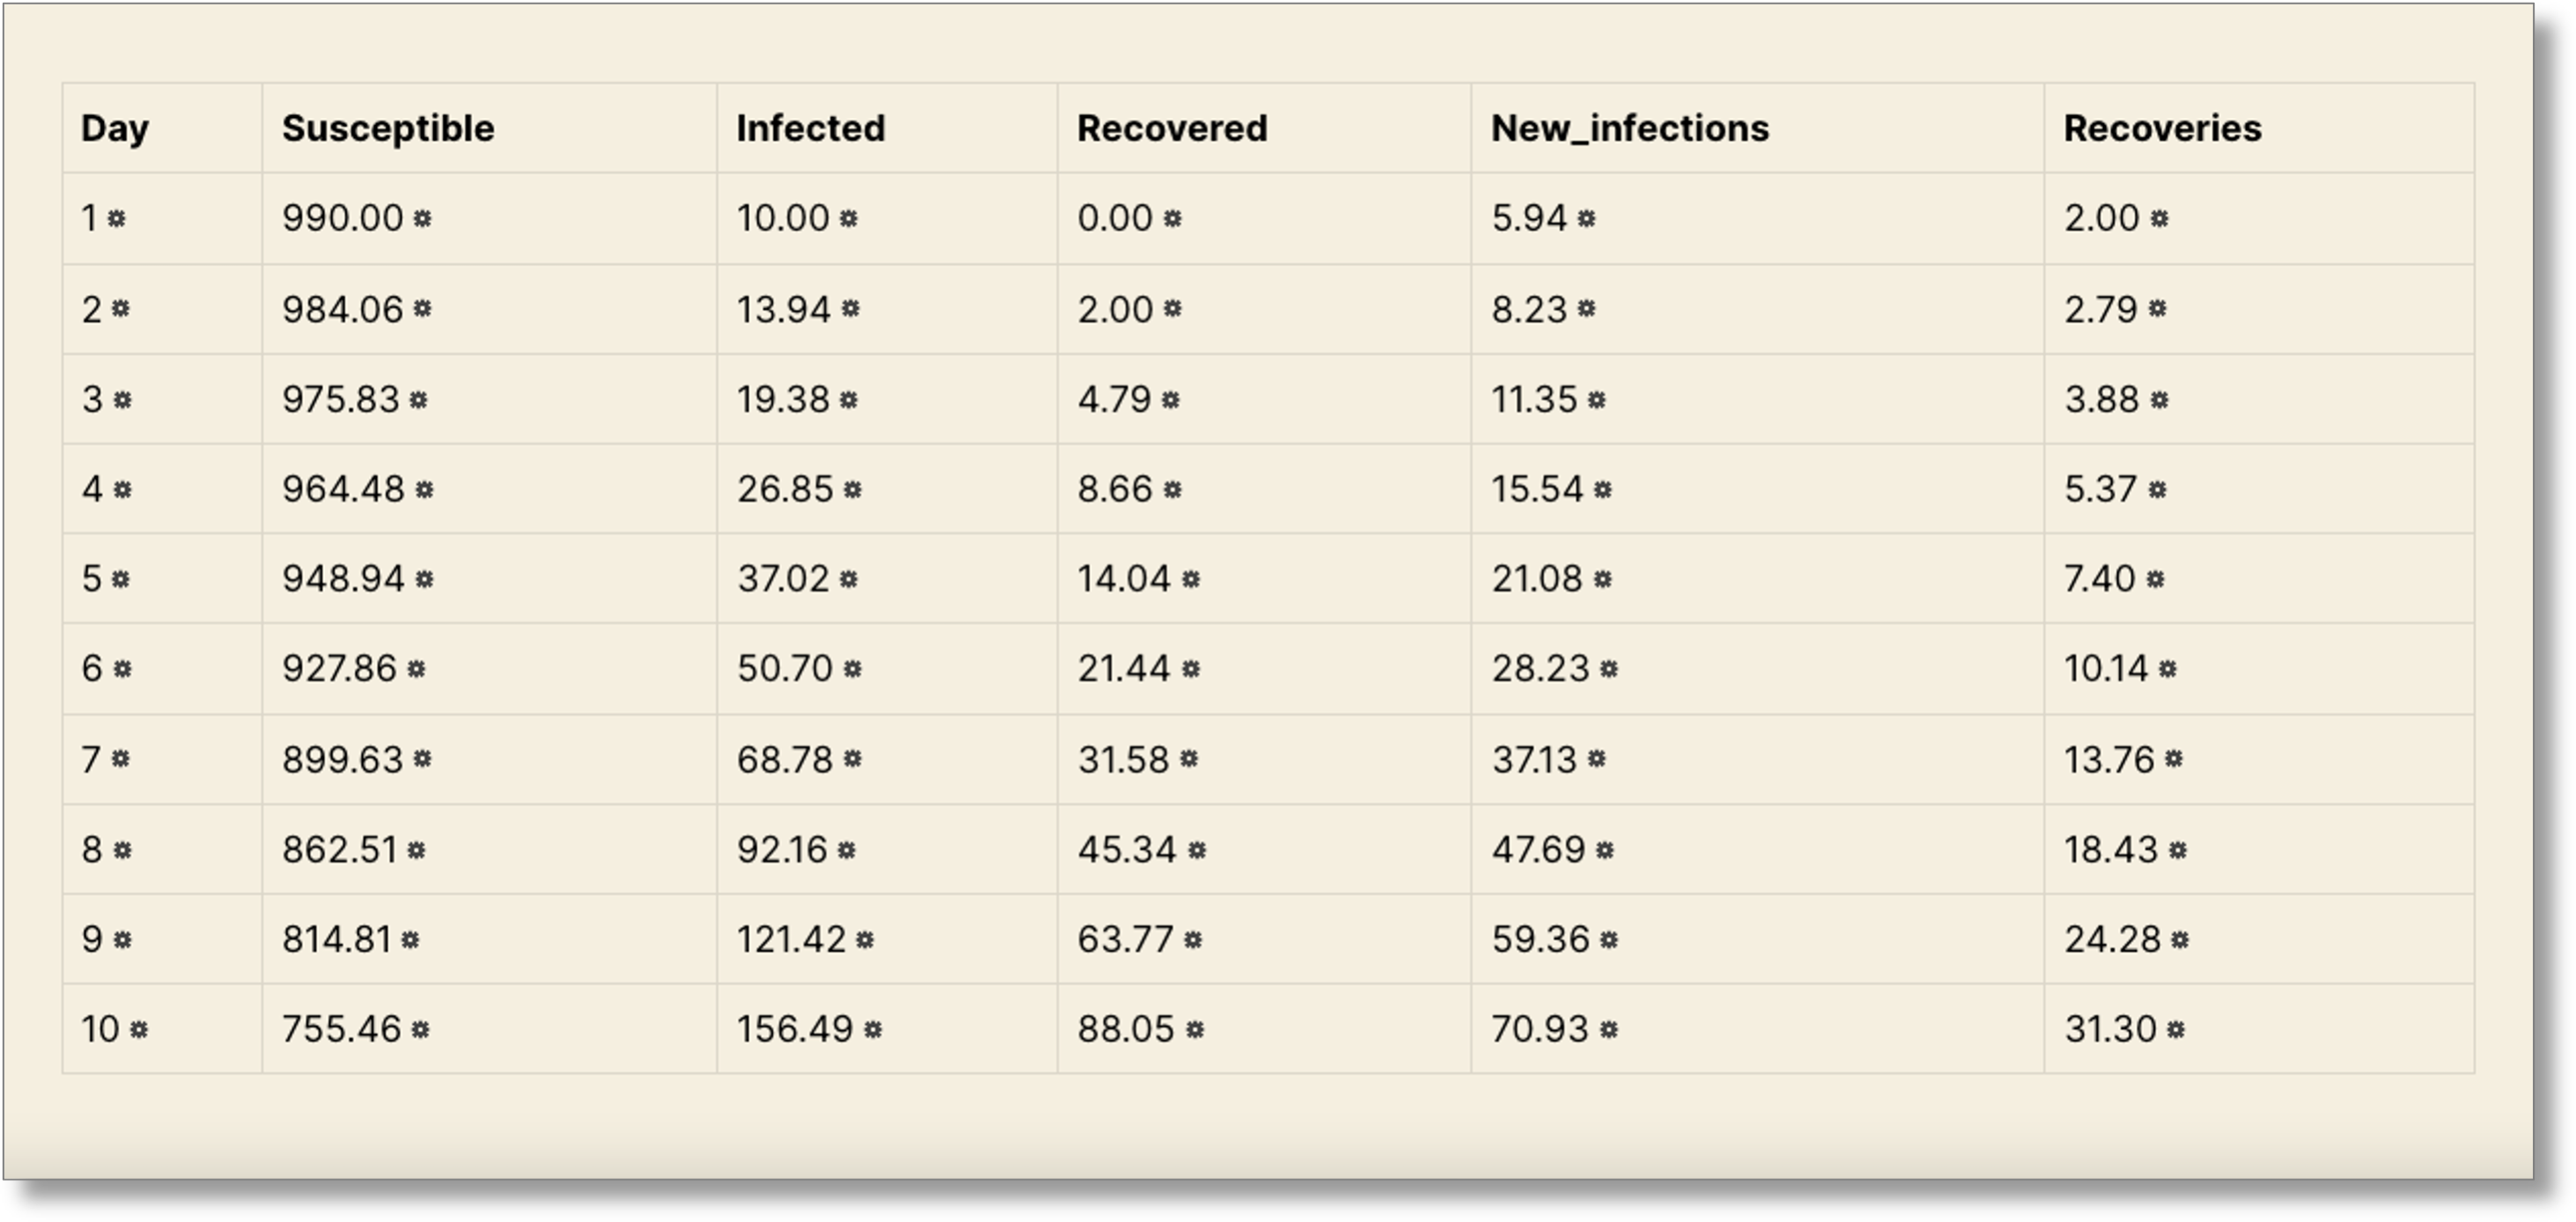
There is an initial pre-amble that describes the model followed by text that includes embedded numbers, some of which are parameters for the model. This is then followed by a table showing the progression of the disease day-by-day based on the parameters. We will return to the table later, but focus first on the initial parameters and other simple values.
End-user exploration
You can imagine creating such a page yourself, but normally this would be with fixed values. However, the values are not fixed and can be (locally) modified by the reader of the page. Here you can see close-ups of parts of the page.
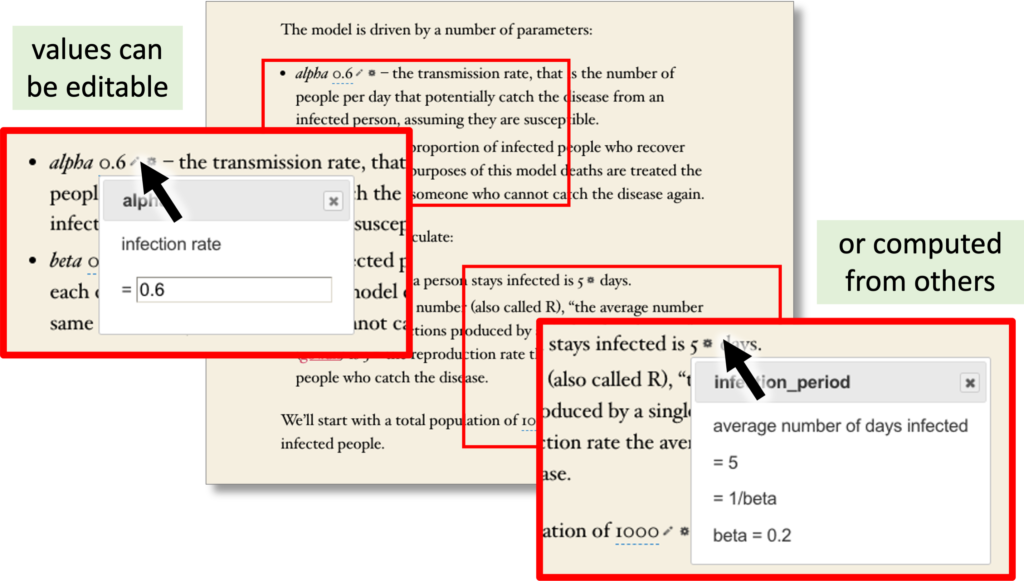
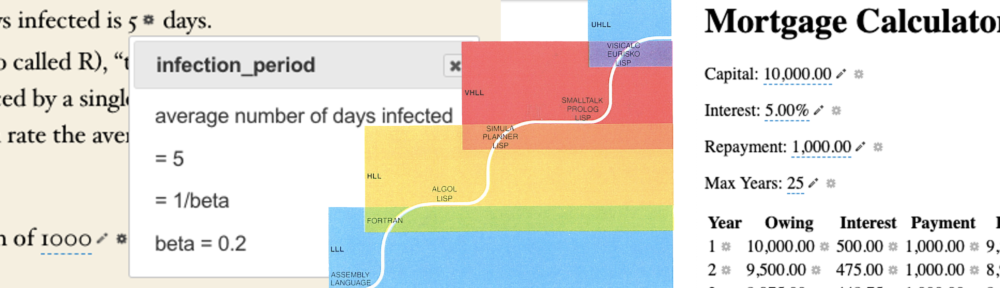
On the left we can see the model parameter alpha being edited, and on the right the infection period being examined showing how it depends on other parameters on the page, in this case 1/beta. Explainability is increasingly being seen as critical for more complex algorithms, but also critical for understanding one’s own calculations, for example in a home-budget spreadsheet.
Notice how the pop up not only gives the formula that is used, but also the values of the various parameters that fed into it, in this case ‘beta = 0.2’.
Tables too
The table uses the parameters to create a day-by-day model of epidemic progression. The values for alpha and beta are quite high, so more like very early in the pandemic before people started taking precautions, but useful to be able to see the changes over time in this example. You can experiment with other values.
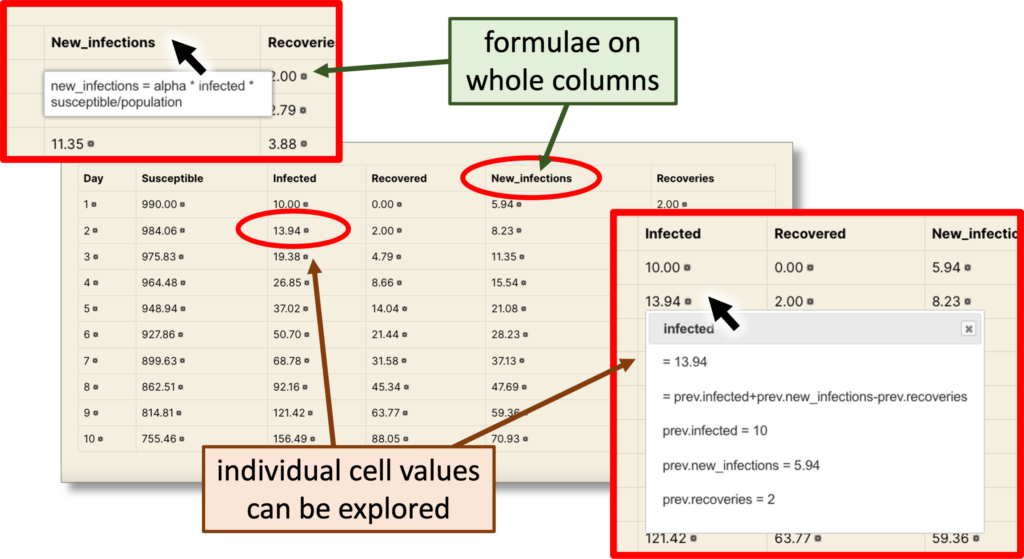
See how the formulae are written as part of the definition of a whole column, not copied and pasted into individual cells (and sometimes forgotten) as they are in a standard spreadsheet. Note how the formula for new_infections includes both parameters such as alpha, which are constant for the whole table, and also other column values, such as infected, which are different for every row.
It is possible to explore individual cell values, just as one can for individual computed values. Here the infected value of 13.94 on day 2 is examined. We can see the column formula on which it is based and also all the other values that are used in the calculation. Note too that this formula uses values from the previous row (e.g. prev.new_infections) to compute the cell value for this row. In a normal spreadsheet this would mean using formula for cell C3 that used references to cells above, in this case C3 would contain the formula C2 + E2 – F2. The WS2 version is somewhat more readable!
Authoring WS2 content
It is possible to create `calculator’ web pages that perform numerical calculations or create graphs, but these require bespoke programming. WS2 makes it easier to create pages like this.
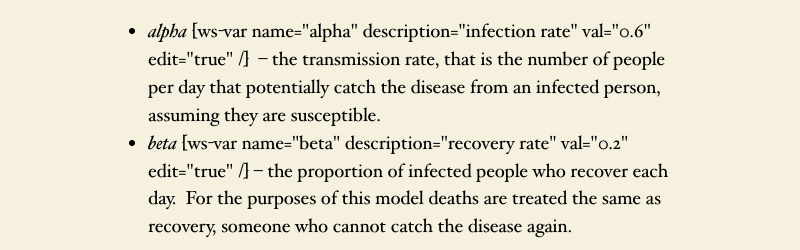
Below you can see the WordPress editor for the page. The editable parameters are simply inserted using a shortcode ‘ws-var’. This shortcode mechanism, which uses square braces, [ ], is familiar to WordPress users as it is used for other kinds of content. The shortcode includes the name of the parameter, ‘alpha‘, initial value, 0.6, and a flag to say it is an editable value. There is also a description, ‘infection rate‘ which is used in the pop up.
Further down the page are values for the infection period and ‘R’, the reproduction number, which is familiar to us all from nightly news updates during the Covid-19 pandemic. You can see below how these have also been entered using WordPress shortcodes:
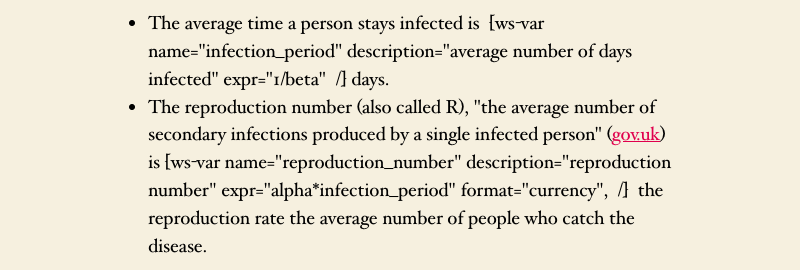
Here instead of an initial value, the expr attribute has a formula. For the value infection_period, this is “1/beta” and for reproduction_number it is “alpha*infection_period“. Note that the formula for reproduction_number (R) uses the value of infection_period, which is itself computed. Just as in a spreadsheet, these values are recomputed when the parameters alpha and beta are edited, allowing the reader of the page to experiment with different, rather abstract of parameters of the SIR model and see how these alter the more comprehensible infection metrics.
Note that the attribute ‘format="currency"‘ in the shortcode is a little confusing. It is there just to force the display to only show two decimal digits. More comprehensive number formatting is on the to-do list.
The authoring of tables is a little more ‘hacky’ at present, but will come soon!
Also in plain HTML
It is also possible to embed WS2 in a plain HTML web page. Here is an example of a simple temperature conversion web page.
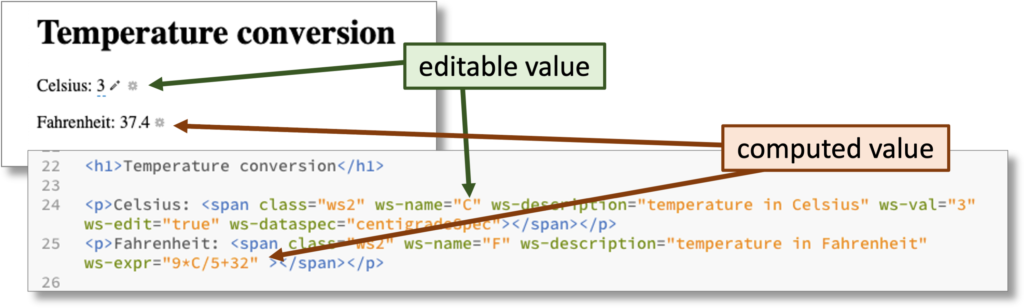
Note the WS2 uses HTML <span> tags with additional attributes similar to those in the WordPress plugin shortcodes.
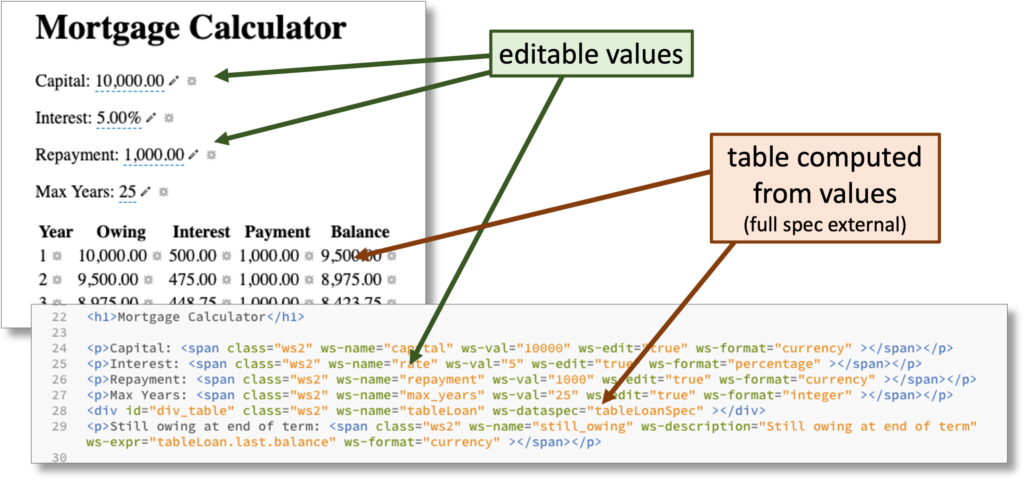
Here is a slightly more complicated example creating a table of annual mortgage repayments.
Under the Hood
For the HTML version WS2 uses jQuery to find all elements with a ws2 class and then interprets these as variable, tables or other blocks depending on the attributes. Additional configuration for more complicated elements, such as tables, can be included in a <script> tag or JavaScript include file, these use the same ‘recipe’ data format that calQ exports and the intention is to link these more seamlessly.
The WS2 plugin translates shortcodes into the same spans and divs with ws2 classes that are used in the HTML version. For tables, or other more complicated elements are converted into a <script> tag that precedes the <div>. In addition, named recipes, for example, for a complex table, can be added in the admin panel and then used by name in multiple pages.
The underlying WS2 engine is based on a recipe, which is a declarative block structured specification. The order of blocks is not significant, so that formulae earlier in the recipe can use values generated further on, as is possible in a spreadsheet. This is important, for example, to allow summary information to be placed earlier with detailed calculation later.
Blocks can be simple variables or tables, but tables can include recipes in their column specification allowing more complex calculations, but with the same visible computation paradigm. For example, one can use the year-by-year mortgage calculation table to works out the total amount of interest paid for a chosen initial deposit and annual repayment. However, this table with its summary values can be turned into a recipe that is used by each row of a table with columns: deposit, repayment, total interest. Effectively with a tiny year-by-year table for each row.
The block mechanisms is extensible and the table is ‘just’ a particular kind of block (albeit a very generally useful one). Blocks have free variables (that is named values they use as inputs) and outputs. However, unlike a function, these are dynamically bound and can change depending on the block configuration, so, in progamming language terms, are better thought of as syntactic extensions.
There is no concrete syntax for recipes, but instead a JSON data structure for recipes that can be thought of as an abstract syntax or data exchange format. At present there is still some hand-editing required for some examples, but the aim is to have more fully functional authoring application mixing text and formulae. calQ can be used already to generate recipes for simple ‘straight line’ formulae, but using a ‘for example; style of creation.
Theory
In 1984 Alan Kay1 wrote a piece about Computer Software, where he compared different software genres, starting with assembly language progressing through high level languages (HLL) such as Fortran and Algol (where many current languages would still sit), through to very high-level languages (VHLL) including Prolog (AI logic programming) and Smalltalk (object oriented), and finally ultra-high-level languages (UHLL) where he placed VISICALC, the first spreadsheet, still new at that time. (He also placed Lisp at virtually every level.).
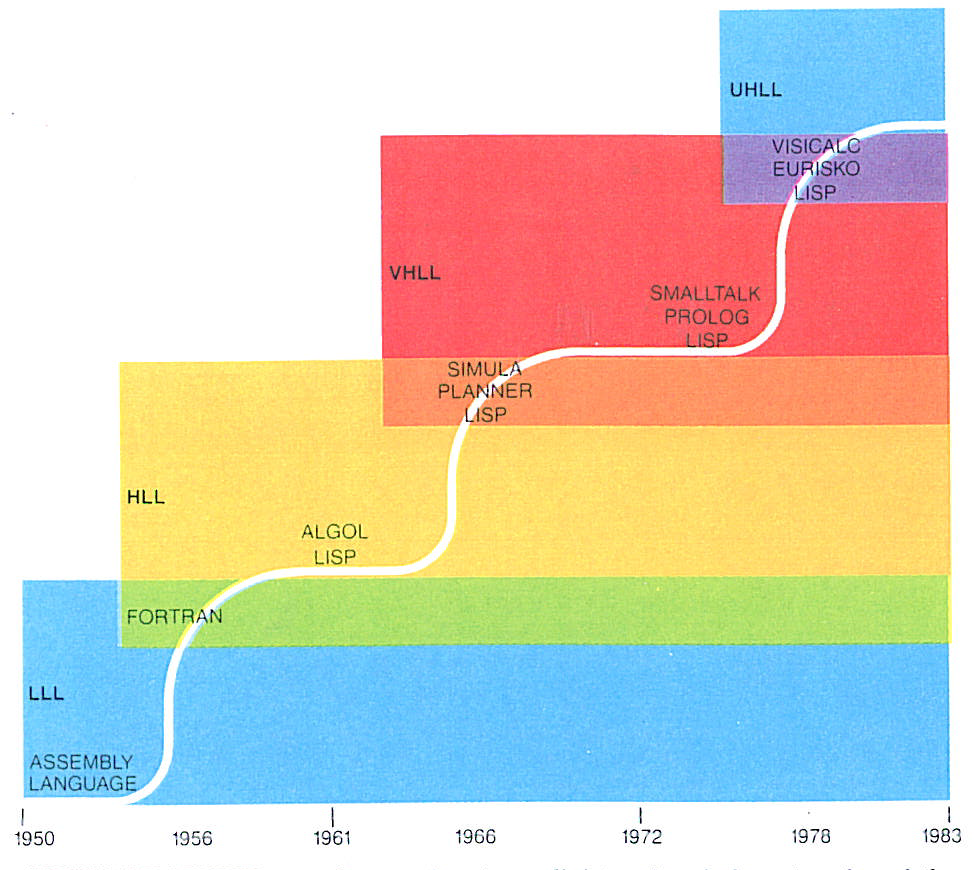
Crucial to his view of VISICALC was the way rules were intimately tied to data, and he looked forward to ways in which the simple numeric spreadsheet could develop, including his own early concept piece, “Opening the Hood of a Word Processor“, for a next generation document processor which would combine text, graphics and computation. See more of Kay’s thoughts on these issues as captured by Mark Guzdial.
Although it is not documented, the timing of this article and a seminar of Alan Kay at Apple in the early 1980s suggests that this paper or the talk was part inspiration for HyperCard and indeed Alan Kay spoke highly of HyperCard, which was a mix of hypertext authoring tool and programming environment.
Knuth’s proposals for literate programming where code and documentation are freely mixed and Thimbleby’s extensions to this to make documentation executable follow a parallel, but related path. Nearly forty years on, current tools such as Jupyter Notebooks take up this same approach, albeit more in a ‘press to run’ paradigm.
The line of thinking embodied in WS2 and calQ connects into these strands of work. As well as a desire to make coding visible and explainable, they also try to tackle the cliff-edge effect when, for example, needing to switch from Excel spreadsheet formulae to Visual Basic. More complex things require more understanding and more effort, but ideally this should be a gradual process, building incrementally on skills and knowledge.
At an even ore theoretical level, one can see the tables = loops paradigm of WS2 as a recognition of the duality between code and (generated) data – variables are just past code remembered. It is often when students debug their code, running through it line by line, seeing the variables change, that they understand the meaning of their code. Seymour Papert understood this when teaching programming to young children, the power of Turtle Graphics was that the execution of the Logo code was evident in the trace left behind on paper. This is equally true for all ages.
- His archives at Viewpoints Research Institute no longer seem to be easily available, but there is a copy at the Internet Archive. [↩]