
It’s not often you see complex statistics mentioned in the news, but today the Guardian described how MRP (multilevel regression and poststratification) analysis was used in assessing changing views about Brexit in the UK.

Guardian 28 May 2023 – More than half of voters now want Britain to forge closer ties with the EU, poll reveals – Dramatic reversal in public opinion seen even in those constituencies that recorded the highest votes to leave
The article was in response to an opinion poll of 10,000 people in the UK on attitudes to the UK’s relationship with the EU, showing that a majority now favour closer ties. The poll used a statistical analysis technique, MRP, :
The survey of more than 10,000 voters, for the internationalist campaign group Best for Britain, accompanied by detailed MRP (multilevel regression and poststratification) analysis based on new constituency boundaries … [Guardian]
Later in the article it explains that:
The MRP method is a well-regarded statistical technique that combines data from detailed polling and other information from sources such as the census and Office for National Statistics data to assign an accurate probability of how different groups will vote in different constituencies. [Guardian]
I don’t recall ever seeing a statistical technique mentioned or justified in this way before in a news article, except maybe some of the reporting of Covid models. I assume the reason that this is done is because Brexit is such a politically volatile subject and they want to protect against ill-informed ‘debunking’.
A large, completely random sample of the UK population would in principle give a fair view of the overall population’s opinion on a topic. However, in practice surveys may not have such a uniform sample. Sometimes this is deliberate, for example, one might deliberately sample more people from an underrepresented group, such as with a specific rare disability, who might otherwise be missed. Sometimes it is an accident of the sampling, for example, if you go to a town centre with clipboards on a Tuesday afternoon you will end up interviewing more pensioners, unemployed and mothers of young babies.
To correct for this on a single factor, say gender, one can take the data for each group and scale it. For example of the overall UK population is 51% female to 49% male1, but if the sample is 40:60 female to male, you would weight the female answers by 51/40 and weight the male responses 49/60.
In practice there are many factors and MRP (multilevel regression and poststratification) is a technique to deal with multiple factors simultaneously comparing the demographics of the survey respondents with population-level data.
Of course, the raw data may show a very different picture from this corrected data. For example, in the UK 2016 Brexit referendum, men voted 55% to 45% to leave the EU, whereas women were marginally (51:49) in favour of remaining in the EU2. If a sample is not balanced for gender the raw results may easily be misleading. Someone accessing the raw data might be confused or deliberately use it to create disinformation, or cast doubt on the reliability of the results.
It is important not just to use the best analysis methods, but also to ensure that those who receive the results trust and, to an appropriate degree, understand them.
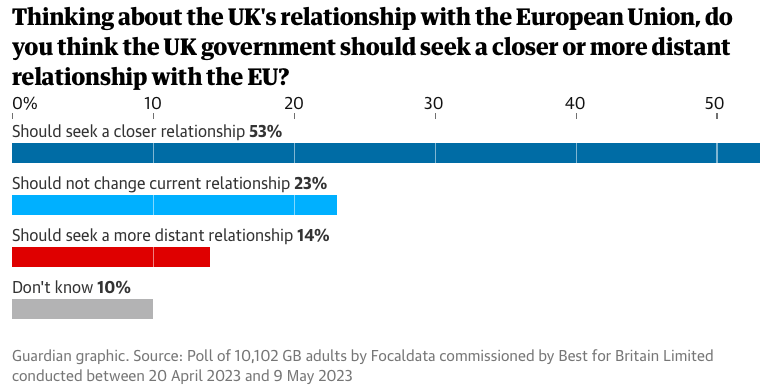
In addition, the nature of the question and the ordering of responses is critical, but often overlooked. In this case the question: “Thinking about the UK’s relationship with the European Union, do you think the UK government should seek a closer or more distant relationship with the EU?” sounds fairly even handed, but would the results be slightly different if the question had said “more distant or closer“?
Ideally I’d also want to look at the context of the survey and previous questions. For example asking the question after a series of other questions about immigration, the economy or Covid response might all affect the answers given.
As the differences were large (53% saying closer, 14% more distant), it seems highly unlikely there would have been a major change in this case, but in general these human issues can be as important than the statistical analysis.
- Gov.uk, “Male and female populations“ [↩]
- Statistica.com, “Share of votes in the Brexit referendum of 2016 in the United Kingdom, by gender“ [↩]