gaining power (4) – tasks

As well as choosing who we ask to participate in our users studies, we can manipulate what we ask them to do, the experimental or study tasks.

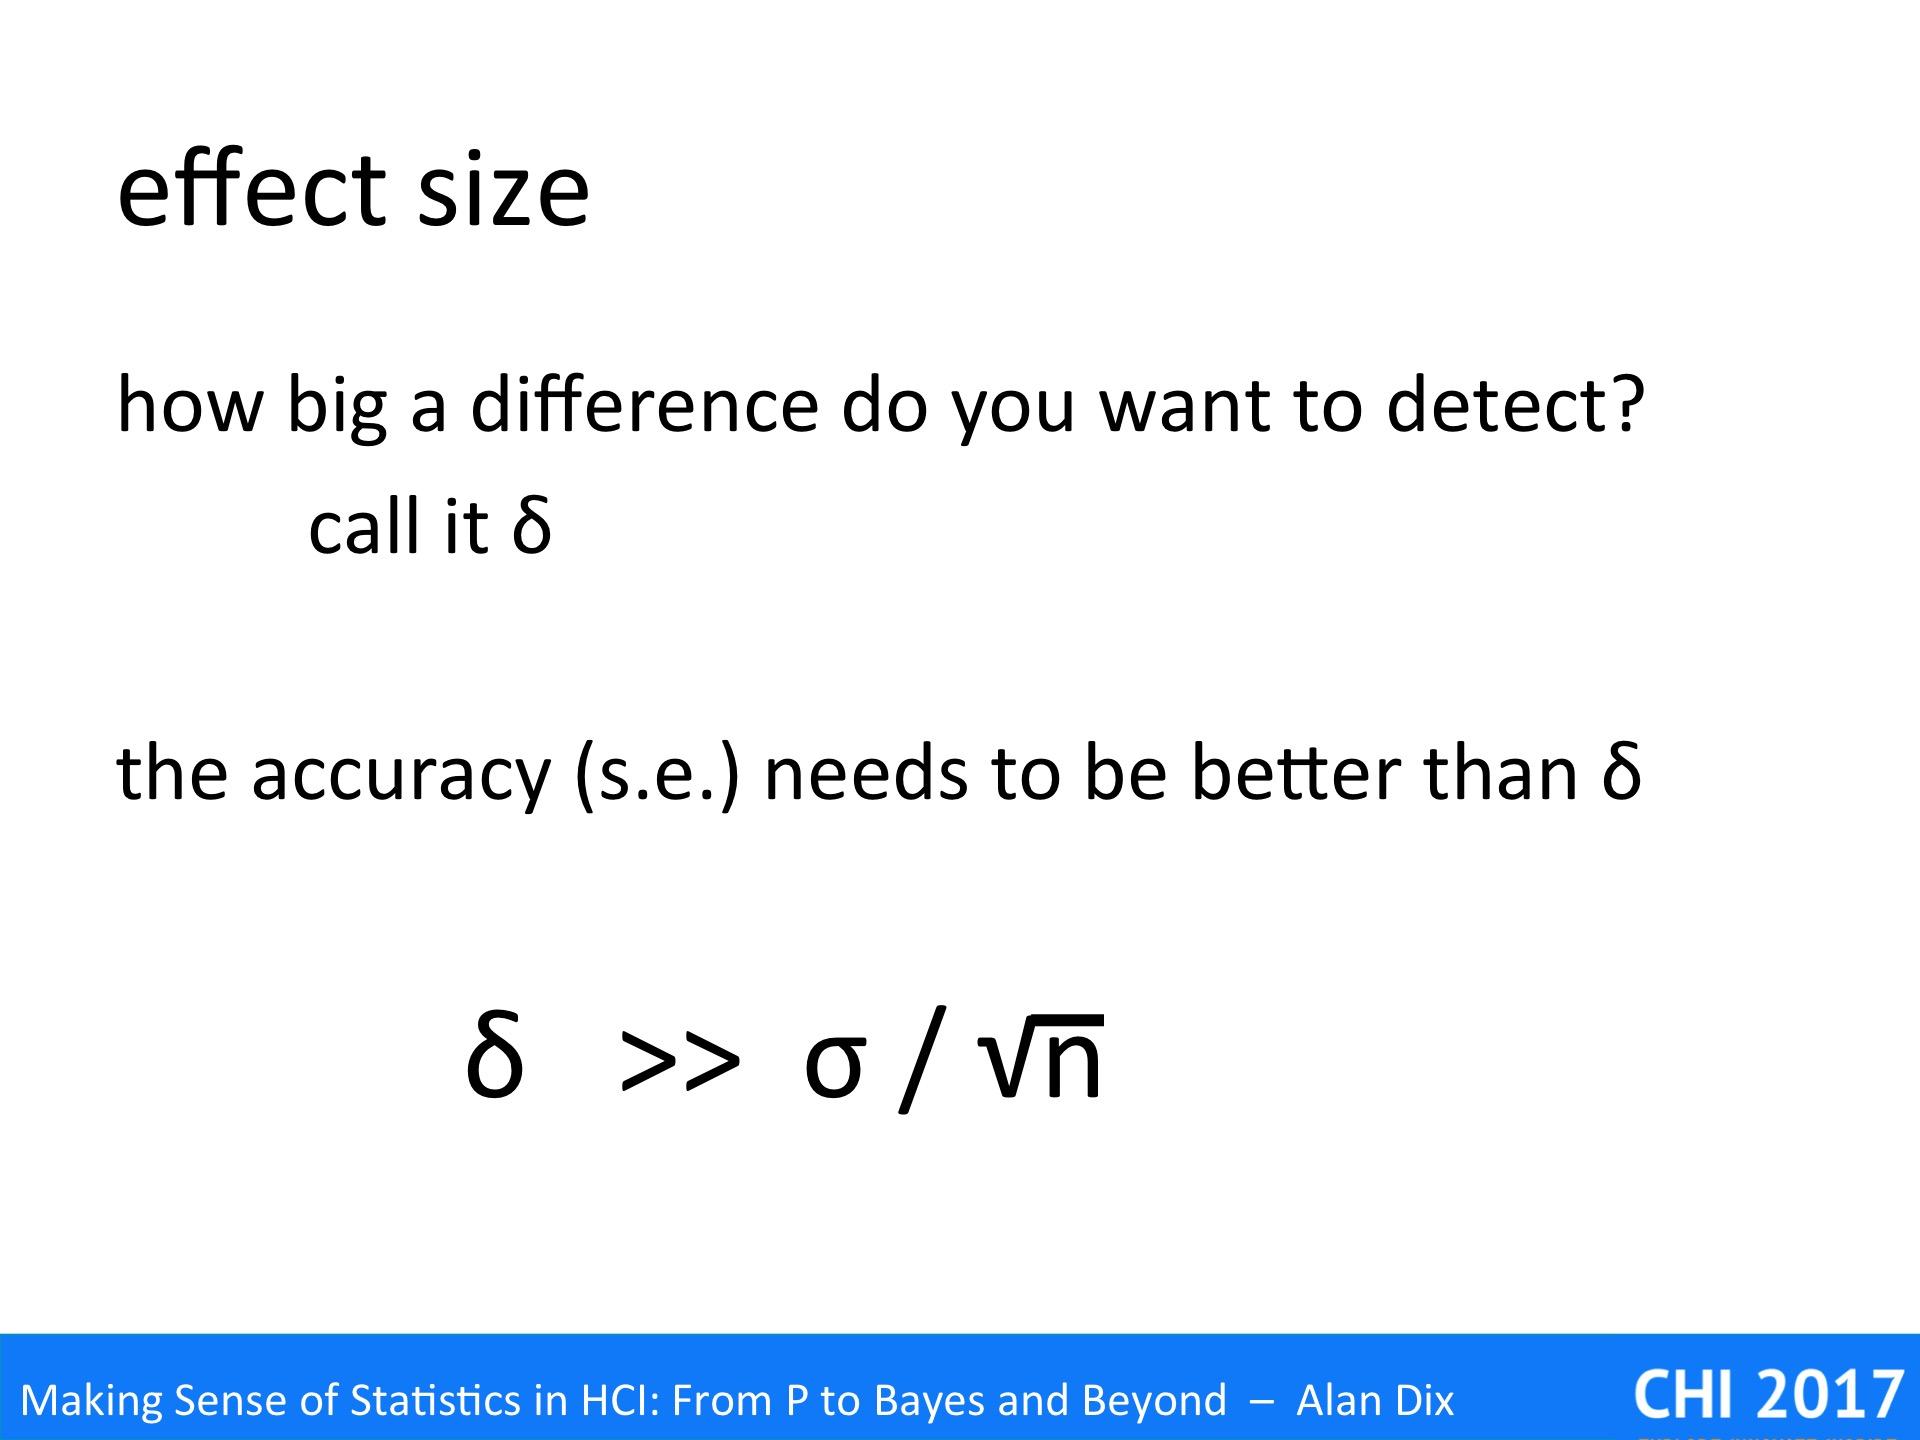
We will look at four strategies

  • distractor tasks (increase effect)
  • targeted tasks (increase effect)
  • demonic interventions! (increase effect)
  • reduced vs wild (reduce noise)

Notably missing are strategies about increasing the number of tasks. While this is possible, and indeed often desirable, the normal reason for this is to increase the diversity of contexts under which you study a phenomenon. Often the differences between tasks are so great it is meaningless to in any way do aggregate statistics across tasks, instead comparisons are made within tasks, with only broad cross-tasks comparisons, for example, f they all lead to improvements in performance.

Typically too, if one does want to aggregate across tasks, the models you take have to be non-linear – if one task takes twice as long as another task, typically variations in it between subjects or trials are also twice as large, or at least substantially larger. This often entails multiplicative rather than additive models of each task’s impact.

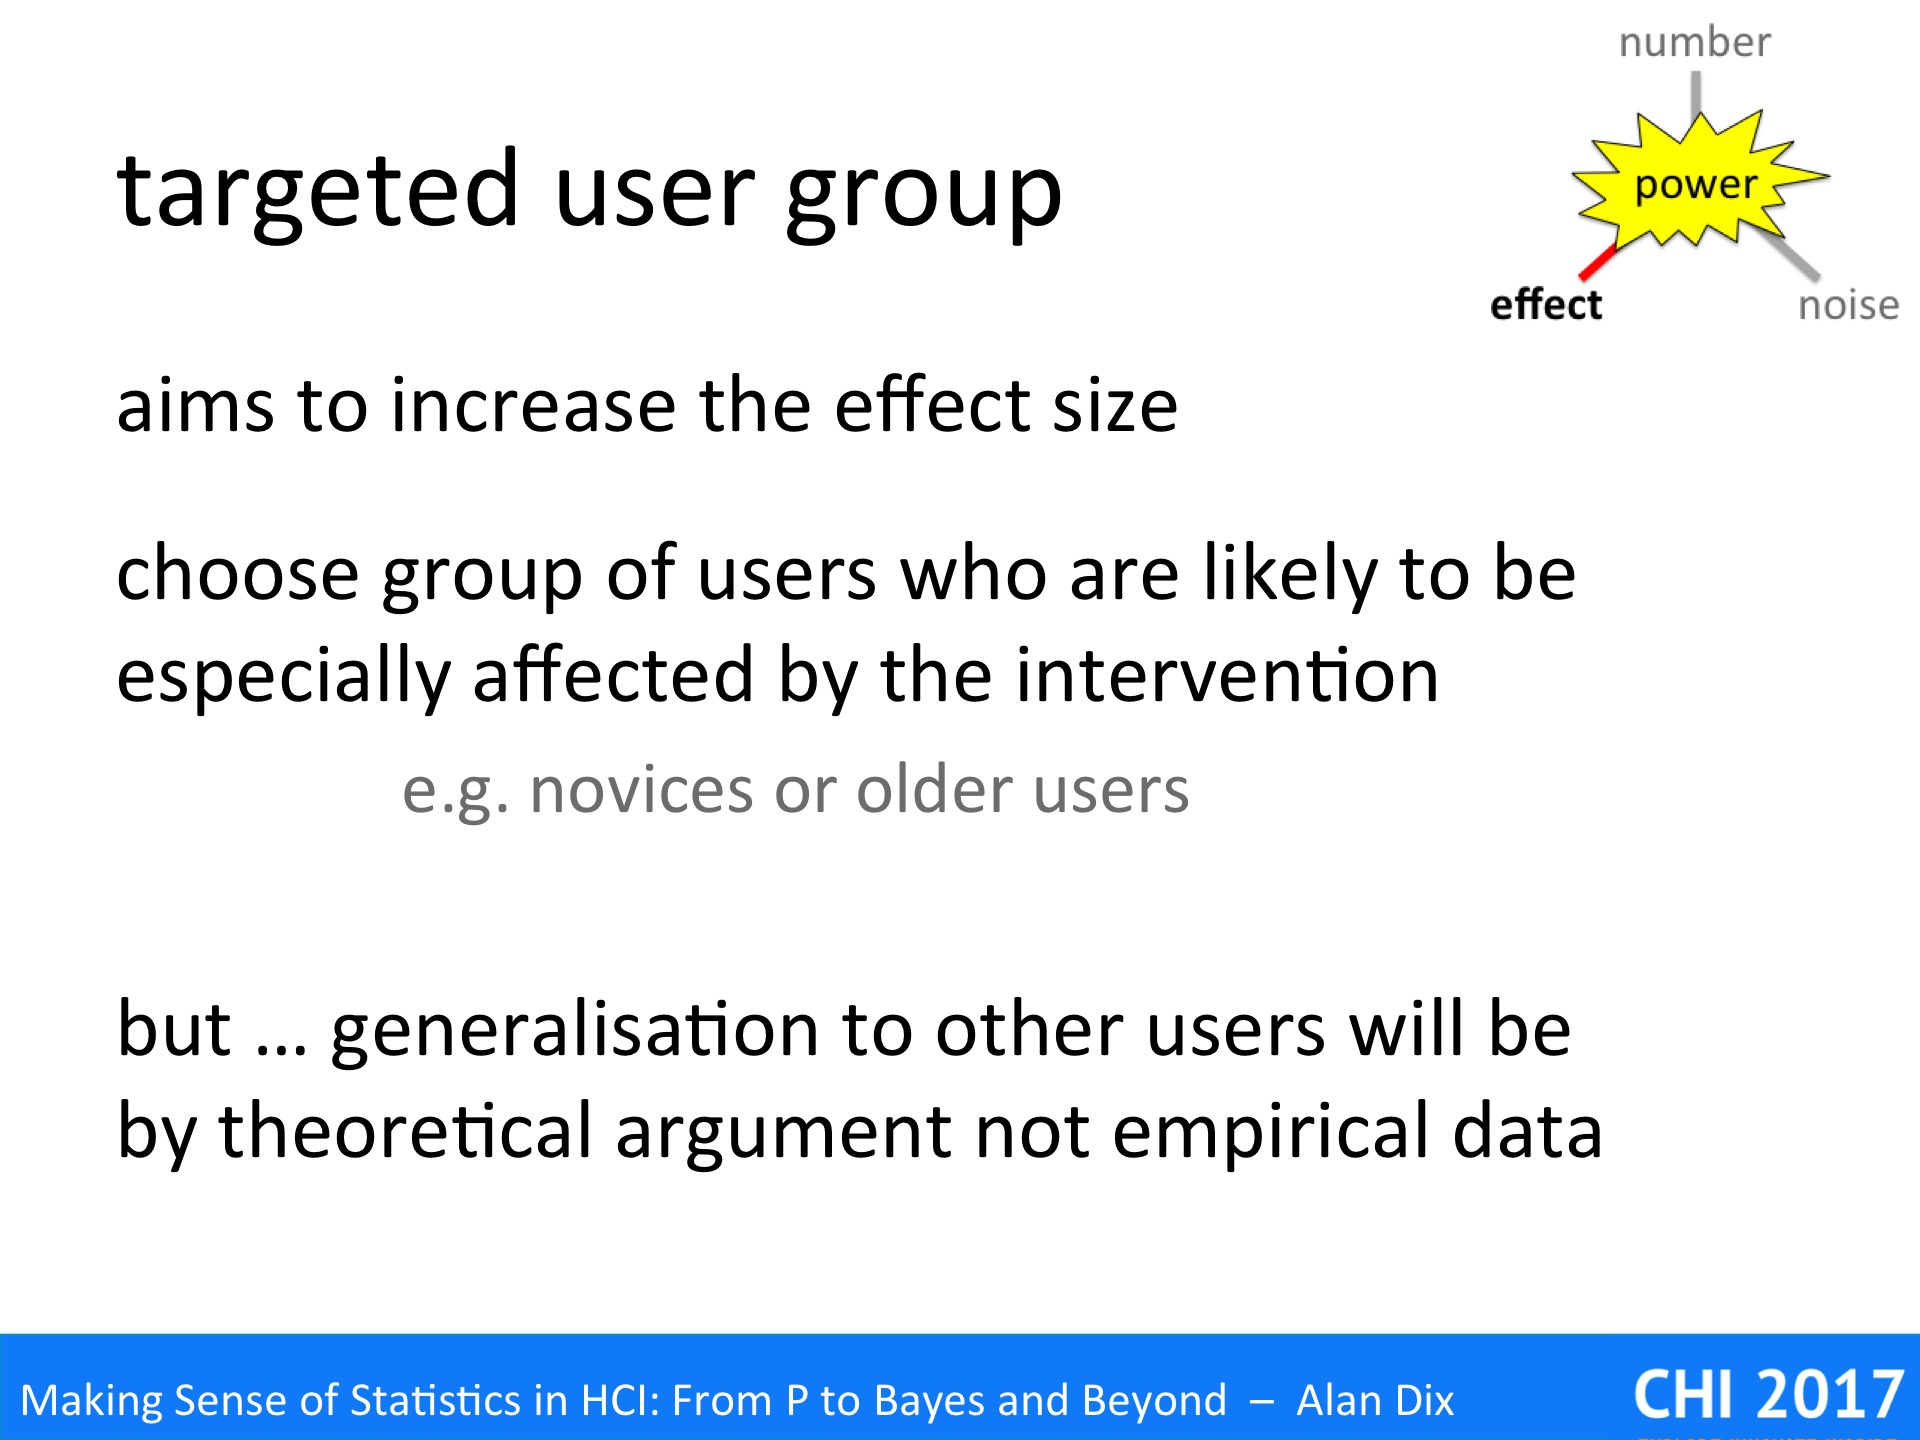
One of the strategies for subjects was to choose a group, say novices, for whom you believe effects will be especially apparent; effects that are there for everyone, but often hidden.

Distractor tasks perform a similar role, but by manipulating the user’s experimental task to make otherwise hidden differences obvious. They are commonly used in ergonomics, but less widely so in HCI or user experience studies; however, they offer substantial benefits.

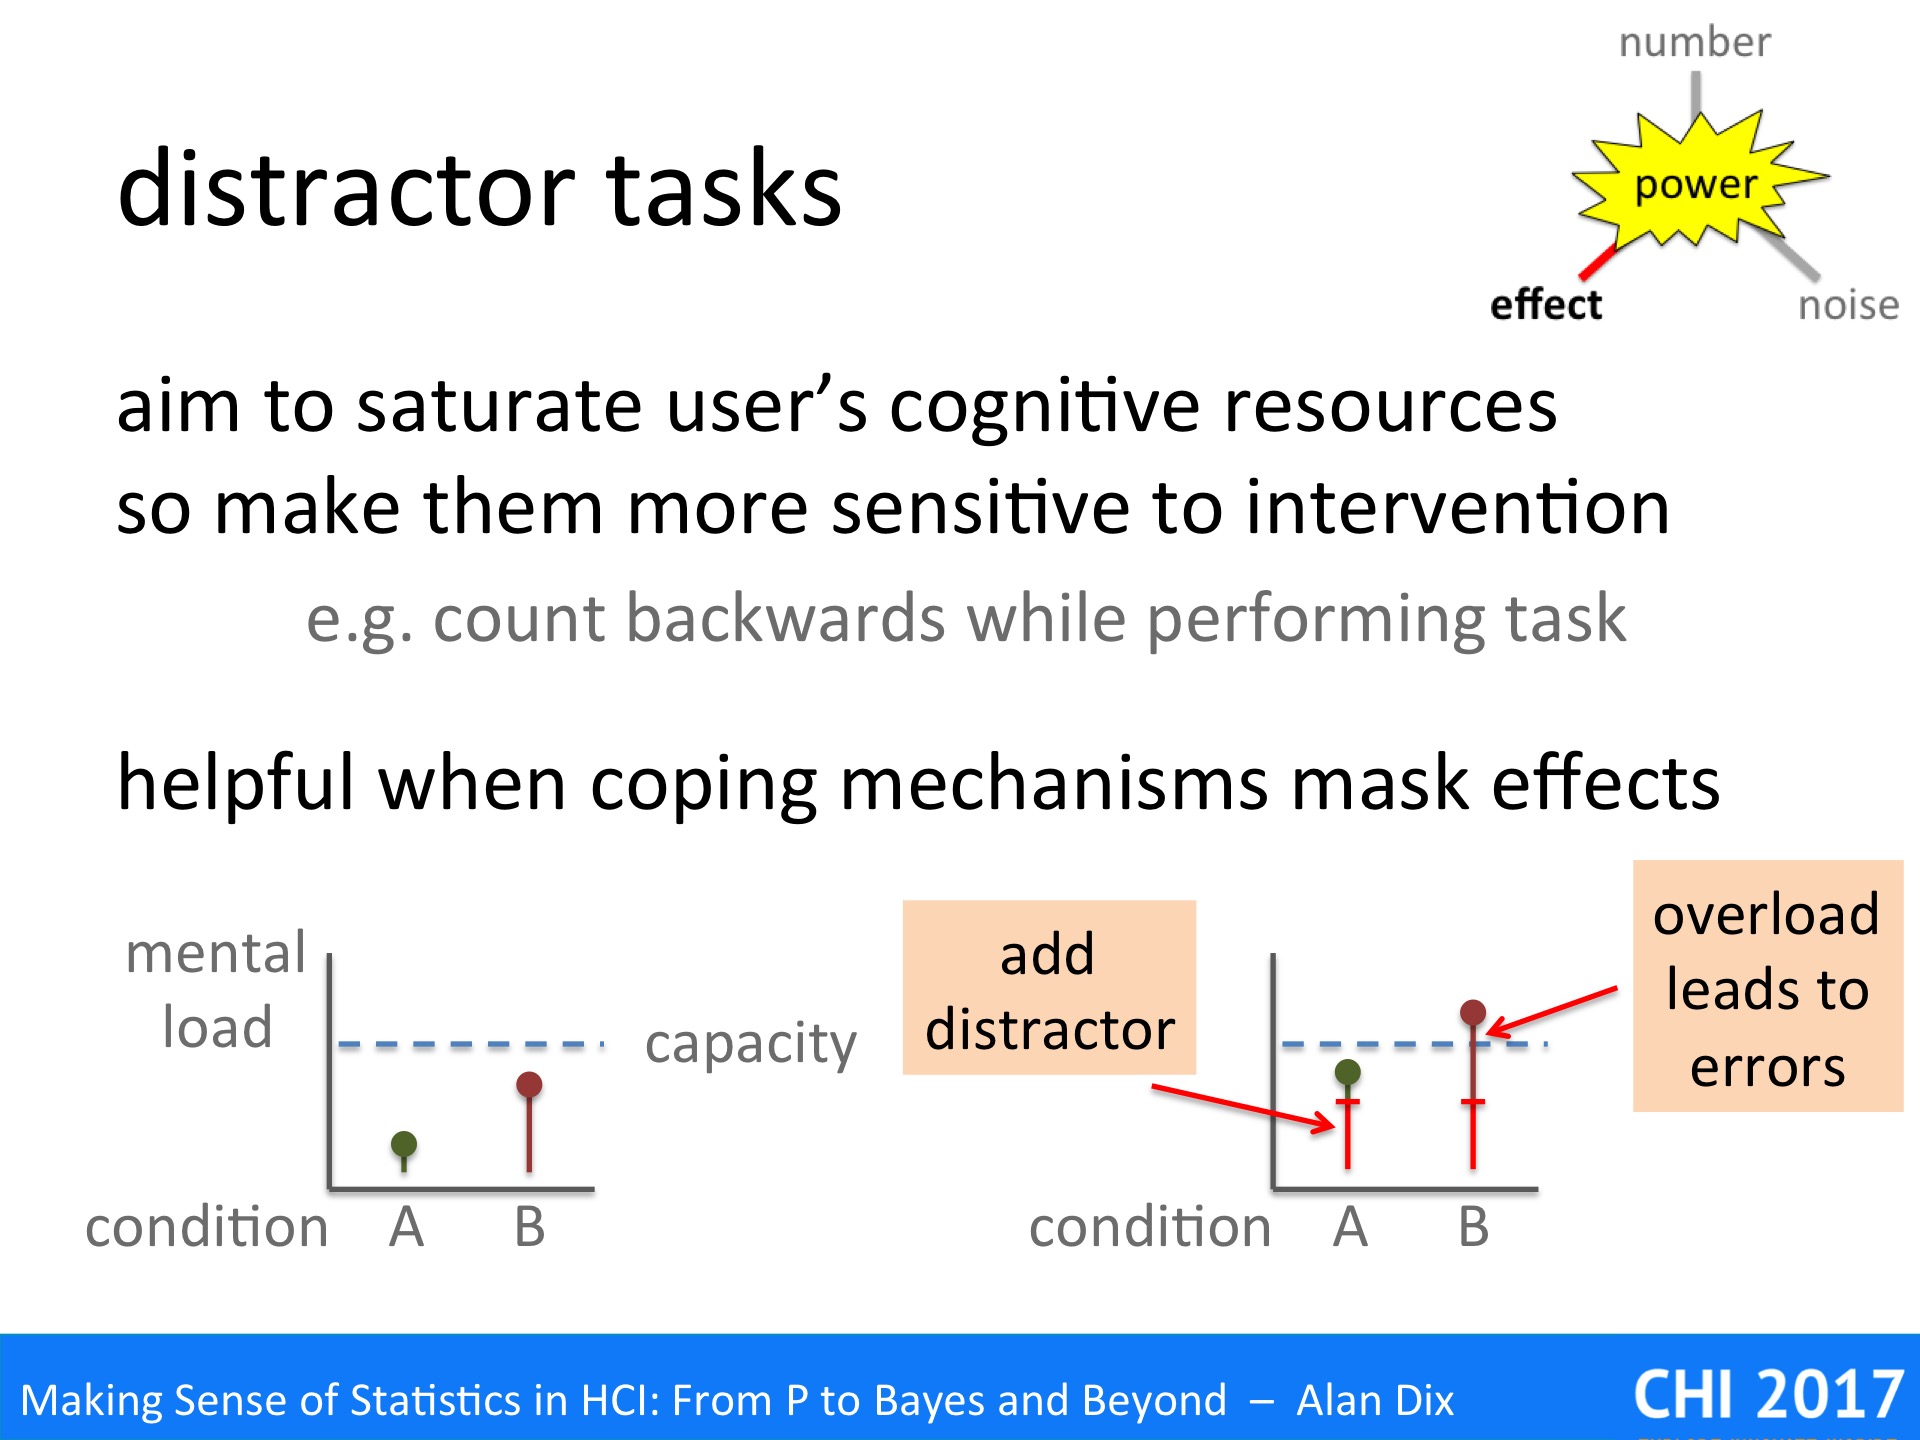
A distractor task is an additional task given during an experimental situation, which has the aim of saturating some aspect of the user’s cognitive abilities, so that differences in load of the systems or conditions being studied become apparent.

A typical example for a usability study might be to ask a subject to count backwards whilst performing the primary task.

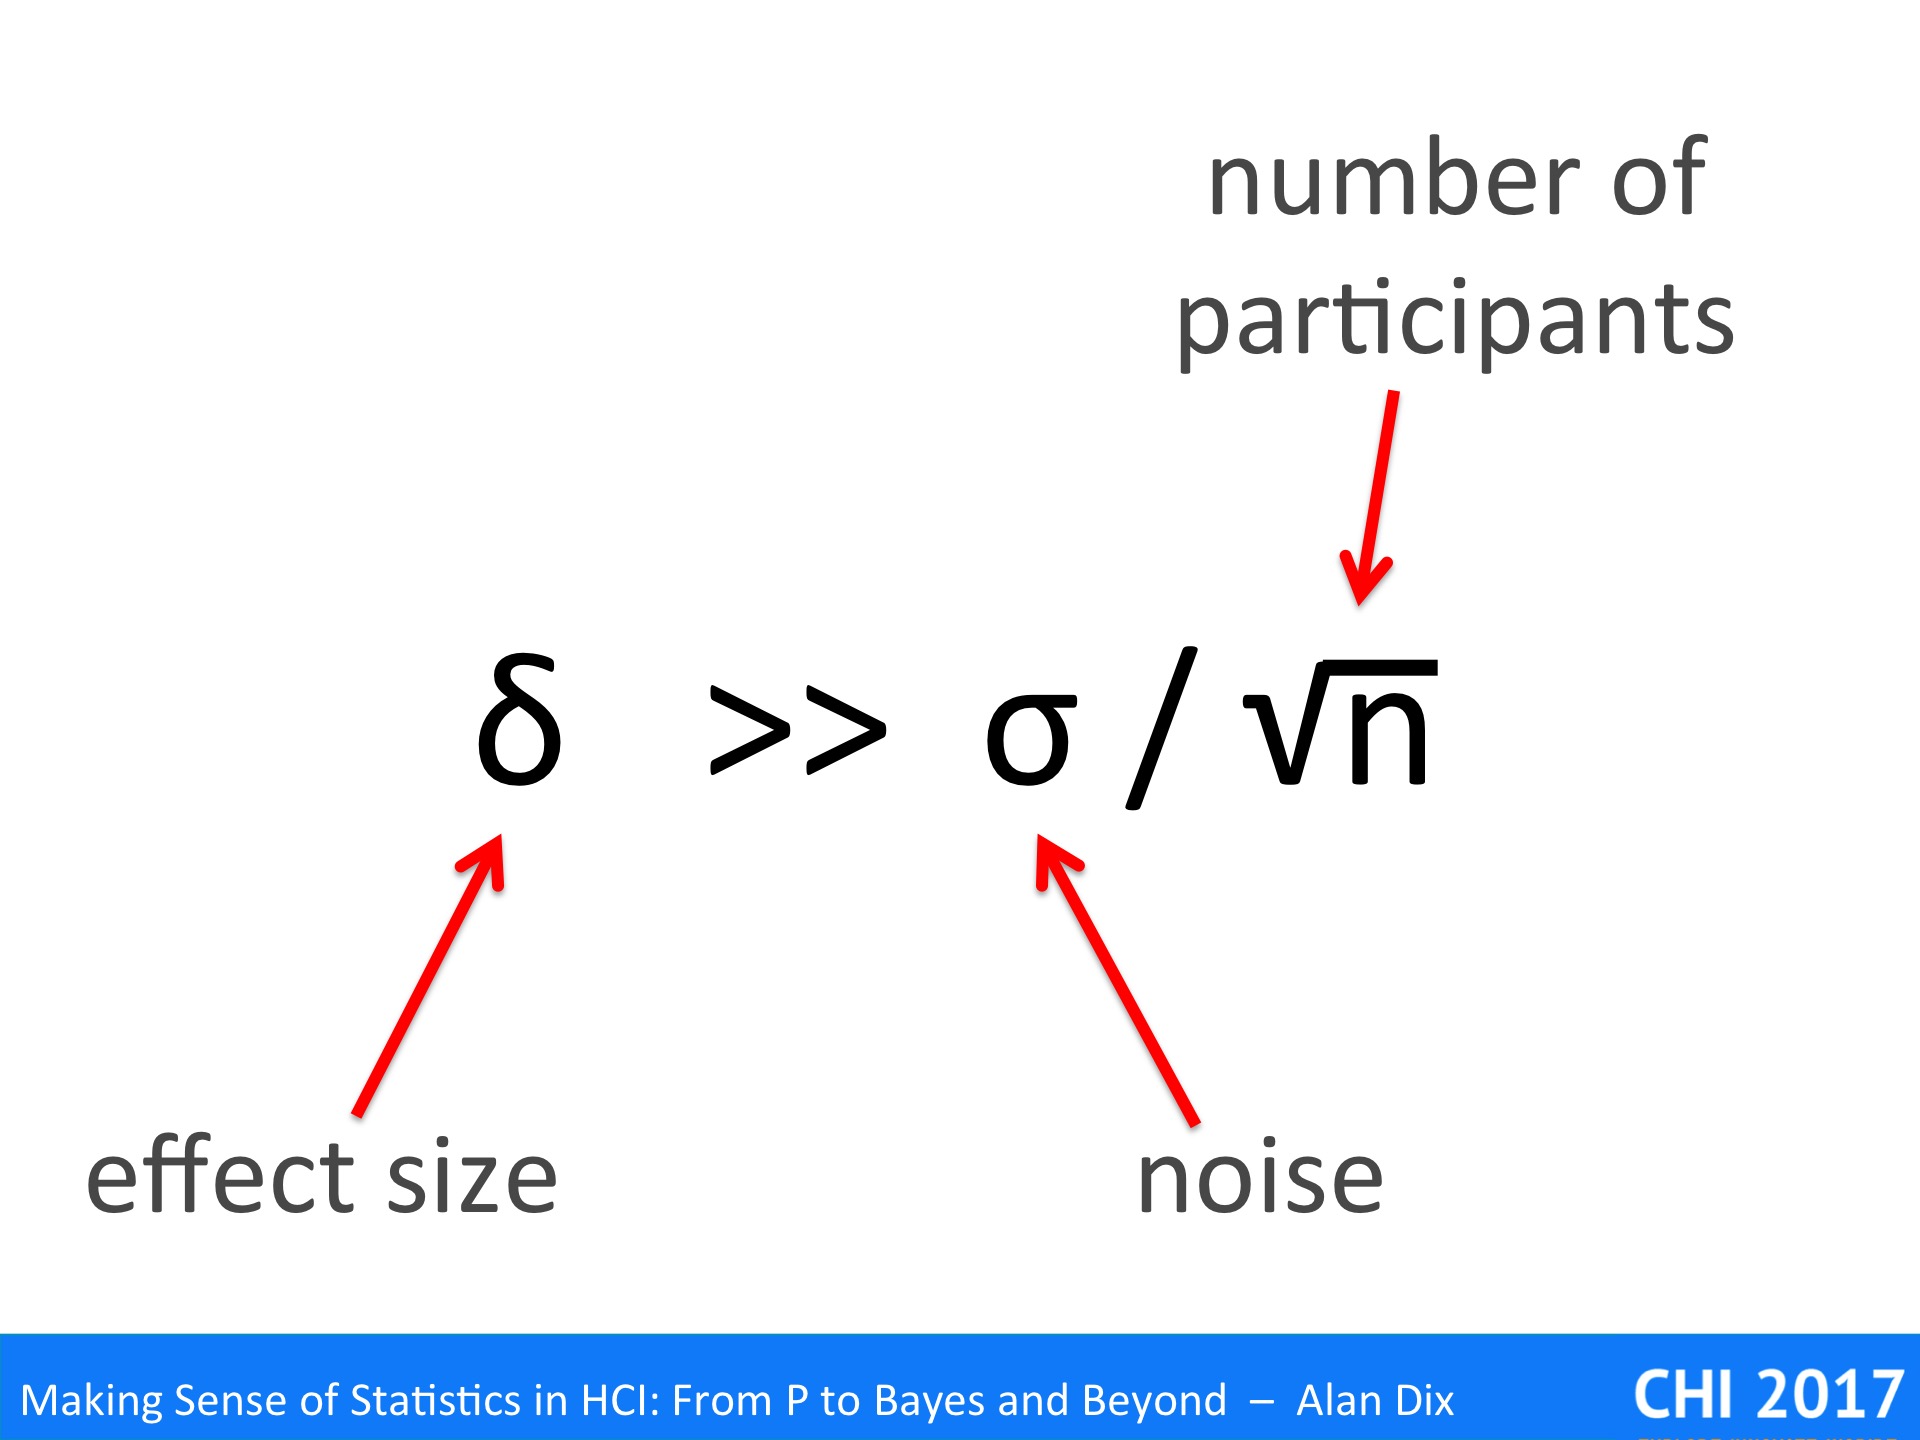
The small graphs show what is happening.   Assume we are comparing two systems A and B. In the example the second system has a greater mental load (graph on the left), but this is not obvious as both are well within the user’s normal mental capacity.

However, if we add the distractor task (graph on the right) both tasks become more difficult, but system B plus the distractor now exceed the mental capacity leading to more errors, slower performance, or other signs of breakdown.

The distractor task can be arbitrary (like counting backwards), or ecologically meaningful.

I first came across distractor tasks when I worked in an agricultural research institute.   There it was common when studying instruments and controls to be installed in a tractor cab to give the subjects a steering task, usually creating a straight plough furrow, whilst using the equipment. By increasing the load of the steering task (usually physically or in simulation driving faster), there would come a point when the driver would either fail to use one of the items of equipment properly, or produce wiggly furrows. This sweet spot, when the driver was just on the point of failure, meant that even small differences in the cognitive load of the equipment under trial became apparent.

A similar HCI example of an ecologically meaningful distractor task is in mobile interface design, when users are tested using an interface whilst walking and avoiding obstacles.

Distractor tasks are particular useful when people employ coping mechanisms. Humans are resilient and resourceful; when faced with a difficult task they, consciously or unconsciously, find ways to manage, to cope. Alternatively it may be that they have sufficient mental resources to deal with additional effort and never even notice.

Either way the additional load is typically having an effect, even when it is not obvious. However, this hidden effect is likely to surface when the user encounters some additional load in the environment; it may be an event such as an interruption, or more long-term such as periods of stress or external distractions.   In a way, the distractor task makes these obvious in the more controlled setting of your user study.

Just as we can have targeted user groups, we can also choose targeted tasks that deliberately expose the effects of our interventions.

For example, if you have modified a word-processor to improve the menu layout and structure, then it makes sense to have a task that involves a lot of complex menu navigation rather than simply typing.

If you have a more naturalistic task, then you may try to instrument it so that you can make separate measurements and observations of the critical parts. For example, in the word-processor your logging software might identify when menu navigation occurs for different functions, log this, and then create response-time profiles for each so that the differences in, say, typing speed in the document itself do not drown out the impact of the menu differences.

Of course this kind of targeting, while informative, can also be misleading, especially in a head-to-head system comparison. In such cases it is worth also trying to administer tasks where the original system is expected perform better than your new, shiny favourite one. Although, it is worth explaining that you have done this, so that reviewers do not take this as evidence your new system is bad! (more on this in part 4 “so what?”)

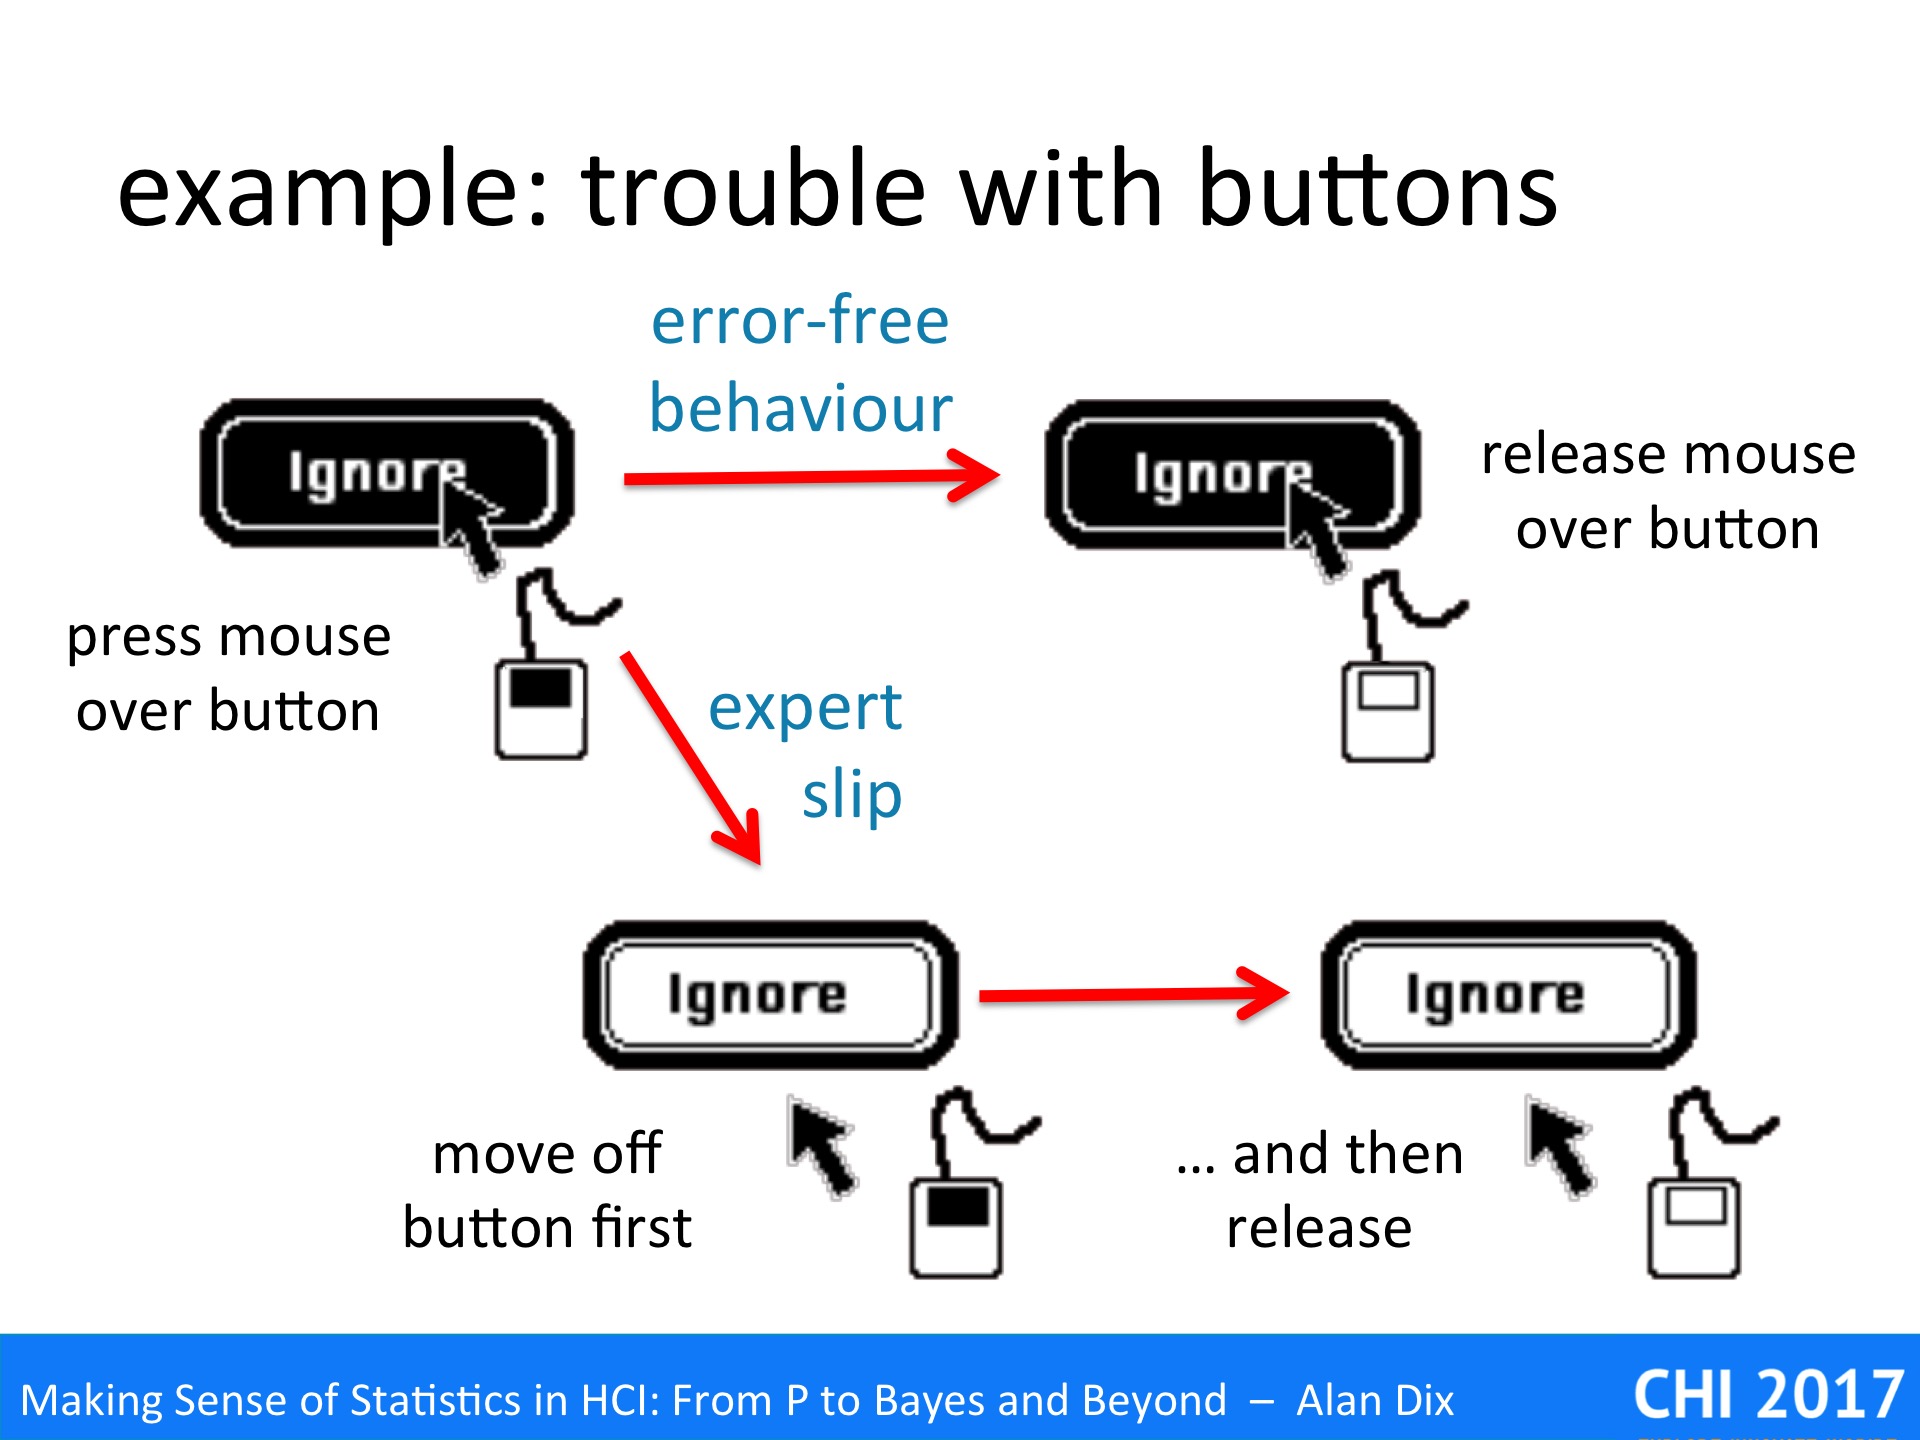
Some years ago I was involved in a very successful example of this principle. Steve Brewster (now Glasgow) was looking at possible sonic enhancement of buttons [DB94]. One problem he looked at was an expert slip, that is an error that experts make, but does not occur with novice use. In this case highly experienced users would occasionally think they had pressed a button to do something, not notice they had failed, and then only much later discover the impact. For example, if they had cut a large body of text and thought they had pasted it somewhere, but hadn’t, then the text would be lost.

Analysing this in detail, we realised that the expert user would almost certainly correctly move the mouse over the button and press it down. Most on-screen buttons allow you to cancel after this point by dragging your mouse off the button (different now with touch buttons). The expert slip appeared to be that the expert started to move the mouse button to quickly as they started to think of the next action.

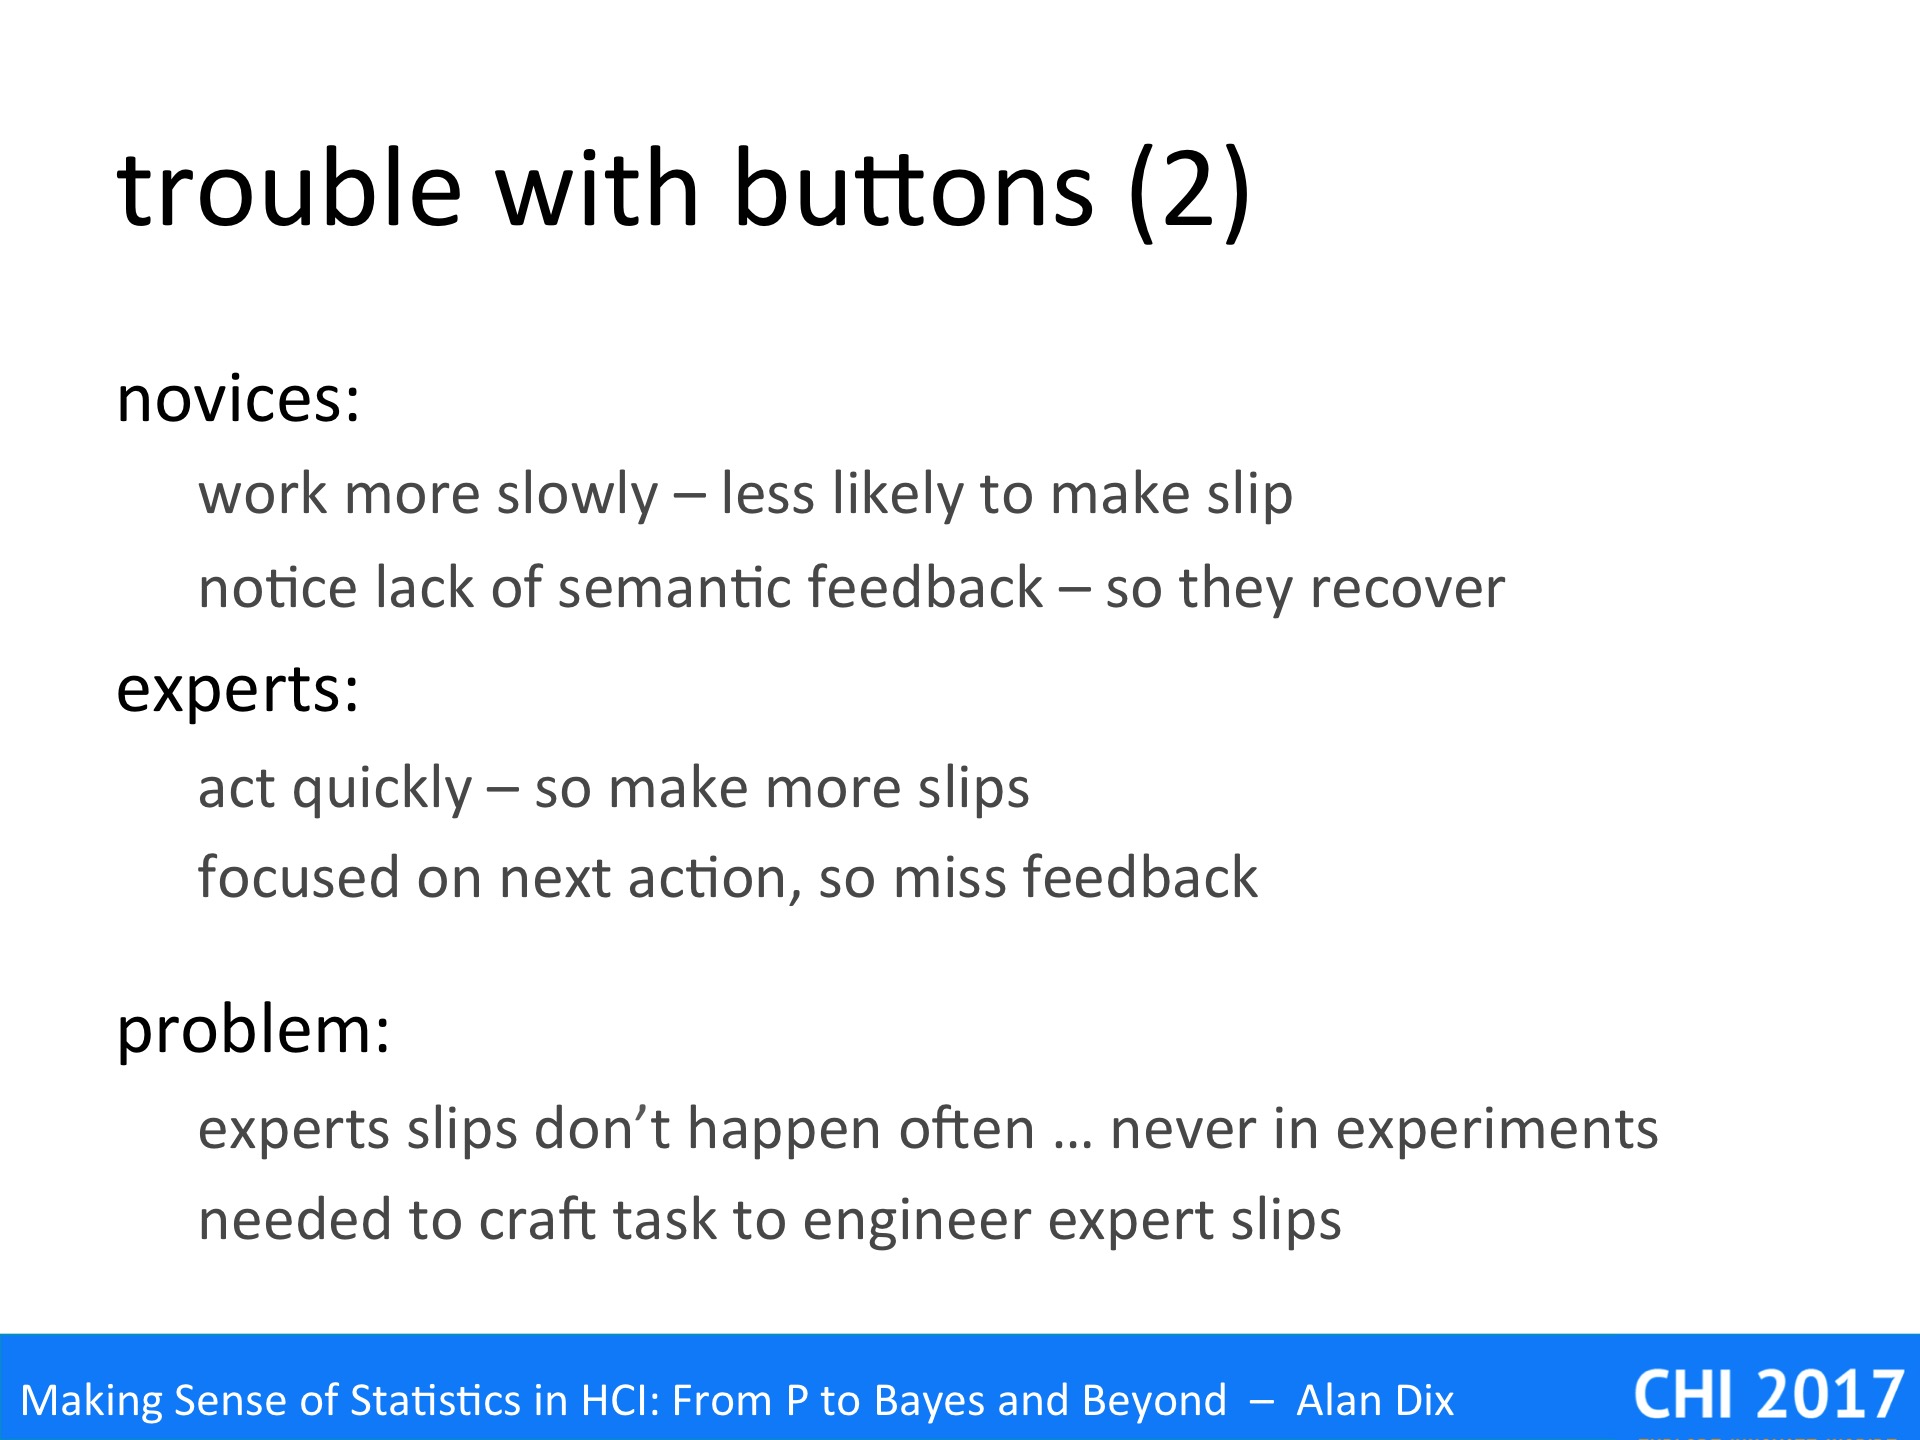
Note a novice user would be less likely to have this error as they would be thinking more carefully about each action, whereas experts tend to think ahead to the next action. Also novices would be more likely to verify the semantic effect of their actions, so that, if they made the slip, they would notice straight away and fix the problem. The expert slip is not so much making the error, but failing to detect it.

Having understood the problem a sonic enhancement was considered (simulated click) that it was believed would solve or at east reduce the problem. However, the problem was that this was an expert slip; it was serious when it occurred, but was very infrequent, perhaps happening only once every month or so.

Attempts to recreate it in a short 10 minute controlled experiment initially failed dramatically. Not only was it too infrequent to occur, even experts behaved more like novices in the artificial environment of a lab experiments, being more careful about their actions and monitoring the results.

One option in the current days of mass web deployment and perpetual beta, would be to have tried both alternatives as an A-B test, but it would be hard to detect even with massive volume as it was such an infrequent problem.

Instead, we turned back to the analysis of the problem and then crafted a task that created the otherwise infrequent expert slip. The final task involved typing numbers using an on-screen keyboard, clicking a button to confirm the number, and then moving to a distant button to request the next number to type. The subjects were put under time pressure (another classic manipulation to increase load), thus maximising the chance that they would slip off the confirm button whilst starting to move the mouse towards the ‘next’ button.

With this new task we immediately got up to a dozen missed errors in every experiment – we had recreated the infrequent expert slip with high frequency and even with novices. When the sonic enhancement was added, slips still occurred, but they were always noticed immediately, by all subjects, every time.

In the extreme one can produce deliberately tasks that are plain nasty!

One example this was in work to to understand natural inverse actions [GD15]. If you reverse in a car using your mirrors it is sometimes hard to know initially which way to turn the steering wheel, but if you turn and it is the wrong direction, or if you over-steer, you simply turn it the opposite way.

We wanted to create such a situation using effectively a Fitts’ Law style target acquisition tasks, with various mappings between two joysticks (in left and right hand) and on-screen pointers. The trouble was that when you reach for something in the real world, you tend to undershoot as overshooting would risk damaging the thing or injuring yourself. This behaviour persists even with an on-screen mouse pointer. However, we needed overshoots to be able to see what remedial action the participants would take.

In order to engineer overshoots we added a substantial random noise to the on-screen movements, so that the pointer behaved in an unpredictable way. The participants really hated us, but we did get a lot of overshoots!

Of course, creating such extreme situations means there are, yet again, problem of generalisation. This is fine if you are trying to understand some basic cognitive or perceptual ability, but less so if you are concerned with issues closer to real use. There is no magic bullet here, generalisation is never simply hand-turning algorithms on data, it is always a matter of the head – an argument based on evidence, some statistical, some qualitative, some theoretical, some experiential.

One of the on-going discussions in HCI is the choice between ‘in-the-wild’ studies [RM17] or controlled laboratory experiments. Of course there are also many steps in between, from semi-realistic settings recreated in a usability labs, to heavily monitored use in the real world.

In general the more control one has over the study, the less uncontrolled variation there is and hence the noise is smaller. In a fully in the wild setting people typically select their own tasks, may be affected by other people around, weather, traffic, etc. Each of these introduces variability.

However, one can still exercise a degree of control, even when conducting research in the wild.

One way is to use reduced tasks. Your participants are in a real situation, their home, office, walking down the street, but instead of doing what they like, you give them a scripted task to perform. Even though you lose some realism in terms of the chosen task, at least you still a level of ecological validity in the environment. These controlled tasks can be interspersed with free use, although this will introduce its own potential for interference as with within subjects experiment.

Another approach is use a restricted device or system. For example, you might lock a mobile phone so that it can only use the app being tested. By cutting down the functionality of the device or application, you can ensure that free use is directed towards the aspects that you wish to study.

A few years ago, before phones all had GPS, one proposed mode of interaction involved taking a photograph and then having image recognition software use it to work out what you were looking at in order to offer location-specific services, such as historical information or geo-annotation [WT04].

Some colleagues of mine were interested in how the accuracy of the image recognition affected the user experience. In order to study this, they modified a version of their mobile tourist guide and added this as a method to enable location. The experimental system used Wizard of Oz prototyping: when the user took a photograph, this was sent to one of the research team who was able to match it against the actual buildings in the vicinity. This yielded a 100% accurate match, but the system then added varying amounts of random errors to emulate automated image recognition.

In order to ensure that the participants spent sufficient time using the image location part, the functionality of the mobile tourist guide was massively reduced, with most audio-visual materials removed and only basic textual information retained for each building or landmark. By doing this, the participants looked at many different landmarks, rather than spending a lot of time on a few, and thus ensured the maximum amount of data concerning the aspect of interest.

The rather concerning downside of this story is that many of the reviewers did not understand this scientific approach and could not understand why it did not use the most advanced media! Happily it was eventually published at mobileHCI [DC05].

References

[DC05] N. Davies, K. Cheverst, A. Dix and A. Hesse (2005). Understanding the Role of Image Recognition in Mobile Tour Guides Proceedings of MobileHCI’2005. ACM Press, pp 191-198 https://alandix.com/academic/papers/MobileHCI2005-camera/

[DB94] A. Dix and S. A. Brewster (1994). Causing Trouble with Buttons. Ancilliary Proceedings of HCI’94, Glasgow, Scotland. Ed. D. England. https://alandix.com/academic/papers/buttons94/

[GD15] Masitah Ghazali, Alan Dix and Kiel Gilleade (2015). The relationship of physicality and its underlying mapping. In 4th International Conference on Research and Innovation in Information Systems 2015, 8-10 December 2015, Malacca (best paper award). Also published in ARPN Journal of Engineering and Applied Science, December 2015, Vol. 10 No. 2). https://alandix.com/academic/papers/ICRIIS-2015-physicality/

[RM17] Yvonne Rogers and Paul Marshall (2017). Research in the Wild. Synthesis Lectures on Human-Centered Informatics. Morgan Claypool. DOI: 10.2200/S00764ED1V01Y201703HCI037

[WT04] Wilhelm, A., Takhteyev, Y., Sarvas, R., Van House, N. and Davis. M.: Photo Annotation on a Camera Phone. Extended Abstracts of CHI 2004. Vienna, Austria. ACM Press, 1403-1406, 2004. DOI: 10.1145/985921.986075

gaining power (3) – subjects

One set of strategies for gaining power are about the way you choose and manage your participants.

We will see strategies that address all three aspects of the noise–effect–number triangle:

  • more subjects or trials (increase number)
  • within subject/group (reduce noise)
  • matched users (reduce noise)
  • targeted user group (increase effect)

First of all is the most common approach: to increase either the number of subjects in your experiment or study, or the number of trials or measurements you make for each one.

Increasing the number of subjects helps average out any differences between subjects due to skill, knowledge, age, or simply the fact that all of us are individuals.

Increasing the number of trials (in a controlled experiment), or measurements, can help average out within subject variation. For example, in Fitts’ Law experiments, given the same target positions, distances and sizes, each time you would get a different response time, it is the average for an individual that is expected to obey Fitts’ Law.

Of course, whether increasing the number of trials or the number of subjects, the points, that we’ve discussed a few times already, remains — you have t increase the number a lot to make a small difference in power. Remember the square root in the formula. Typically to reduce the variation of the average by two you need to quadruple the number of subjects or trials; this sounds do-able. However, if you need to decrease the variability of the mean by a factor of then then you need one hundred times as many participants or trials.

In Paul Fitts’ original experiment back in 1954 [Fi54], he had each subject try 16 different conditions of target size and distance, as well as two different stylus weights. That is he was performing what is called a within subjects experiment.

An alternative experiment could have taken 32 times as many participants, but have each one perform for a single condition. With enough participants this probably would have worked, but the number would probably have needed to be enormous.

For low-level physiological behaviour, the expectation is that even if speed and accuracy differ between people, the overall pattern will be the same; that is we effectively assume between subject variation of parameters such as Fitts’ Law slope will be far less than within subject per-trial variation.

Imagine we are comparing two different experimental systems A and B, and have recorded users’ average satisfaction with each. The graph in the slide above has the results (idealised not real data). If you look at the difference for each system A is always above system B, there is clearly an effect. However, imagine jumbling them up, as if you had simply asked two completely different sets of subjects, one for system A and one for system B – the difference would probably not have shown up due to the large between subject differences.

The within subject design effectively cancels out these individual differences.

Individual differences are large enough between people, but are often even worse when performing studies involving groups of people collaborating. As well as the different people within the groups, there will be different social dynamics at work within each group. So, if possible within group studies perhaps even more important in this case.

However, as we have noted, increased power comes with cost, in the case of within subject designs the main problem is order effects.

For a within subjects/groups experiment, each person must take part in at least two conditions. Imagine this is a comparison between two interface layouts A and B, and you give each participant system A first and then system B. Suppose they perform better on system B, this could simply be that they got used to the underlying system functionality — a learning effect. Similarly, if system B was worse, this may simply be that users got used to the particular way that system A operated and so were confused by system B — an interference effect.

The normal way to address order effects, albeit partially, is to randomise or balance the orders; for example, you would do half the subjects in the order A–B and half in the order B–A. More complex designs might include replications of each condition such as ABBA, BAAB, ABAB, BABA.

Fitts’ original experiment did a more complex variation of this, with each participant being given the 16 conditions (of distance and size) in a random order and then repeating the task later on the same day in the opposite order.

These kinds of designs allow one to both cancel out simple learning/interference effects and even model how large they are. However, this only works if the order effects are symmetric; if system A interferes with system B more than vice versa, there will still be underlying effects. Furthermore, it is not so unusual that one of the alternatives is the existing one that users are used to in day-to-day systems.

There are more sophisticated methods, for example giving each subject a lot of exposure to each system and only using the later uses to try to avoid early learning periods. For example, ten trials with system A followed by ten with system B, or vice versa, but ignoring the first five trials for each.

For within-subjects designs it would be ideal if we could clone users so that there are no learning effects, but we can still compare the same user between conditions.

One way to achieve this (again partially!) is to have different user, but pair up users who are very similar, say in terms of gender, age, or skills.

This is common in educational experiments, where pre-scores or previous exam results are used to rank students, and then alternate students are assigned to each condition (perhaps two ways to teach the same material). This is effectively matching on current performance.

Of course, if you are interested in teaching mathematics, then prior mathematics skills are an obvious thing to match. However, in other areas it may be less clear, and if you try to match on too many attributes you get combinatorial explosion: so many different combinations of attributes you can’t find people that match on them all.

In a way matching subjects on an attribute is like measuring the attribute and fittings a model to it, except when you try to fit an attribute you usually need some model of how it will behave: for example, if you are looking at a teaching technique, you might assume that post-test scores may be linearly related to the students’ previous year exam results. However, if the relationship is not really linear, then you might end up thinking you have fond a result, which was in fact due to your poor model. Matching subjects makes your results far more robust requiring fewer assumptions.

A variation on matched users is to simply choose a very narrow user group. In some ways you are matching by making them all the same. For example, you may deliberately choose 20 year old college educated students … in fact you may do that by accident if you perform your experiments on psychology students! Looking back at Fitts original paper [Fi54] says, “Sixteen right-handed college men serves as Ss (Subjects)”, so there is good precident. By choosing participants of the same age and experience you get rid of a lot of the factors that might lead to individual differences. Of course there will still be personal differences due to the attributes you haven’t constrained, but still you will be reducing the overall noise level.

The downside of course, is that this then makes it hard to generalise. Fitts’ results were for right-handed college men; do his results also hold for college women, for left-handed people, for older or younger or less well educated men? Often it is assumed that these kinds of low level physiological experiments are similar in form across different groups of people, but this may not always be the case.

Henrich, Heine and Norenzayan [HH10] reviewed at a number of psychological results that looked as though they should be culturally independent. The vast majority of fundamental experiments were performed on what they called WEIRD people (Western, Educated, Industrialized, Rich, and Democratic), but where there were results form people of radically different cultural backgrounds, there were often substantial differences. This even extended to low-level perceptions.

You may have seen the Müller-Lyer illusion: the lower line looks longer, but in fact both lines are exactly the same length. It appears that this illusion is not innate, but due to being brought up in an environment where there are lots of walls and rectilinear buildings. When children and adults from tribes in jungle environments are tested, they do not perceive the illusions and see the lines as the same length.

We can go one step further and deliberately choose a group for whom we believe we will see the maximum effect. For example, imagine that you have designed a new menu system, which you believe has a lower short-term memory requirement. If you test it on university students who are typically young and have been honing their memory skills for years, you may not see any difference. However, short-term memory loss is common as people age, so if you chose more elderly users you would be more likely to see the improvements due to your system.

In different circumstances, you may deliberately choose to use novice users as experts may be so practiced on the existing system that nothing you do makes any improvement.

The choice of a critical group means that even small differences in your system’s performance have a big difference for the targeted group; that is you are increasing the effect size.

Just as with the choice of a narrow type of user, this may make generalisation difficult, only more so. With the narrow, but arbitrary group, you may argue that in fact the kind of user does not matter. However, the targeted choice of users is specifically because you think the criteria on which you are choosing them does matter and will lead to a more extreme effect.

Typically in such cases you will use a theoretical argument in order to generalise. For example, suppose your experiment on elderly users showed a statistically significant improvement with your new system design. You might then use a combination of qualitative interviews and detailed analysis of logs to argue that the effect was indeed due to the reduced short-term memory demand of your new system. You might then argue that this effect is likely to be there for any group of users, creating and additional load and that even though this is not usually enough to be apparent, it will be interfering with other tasks the user is attempting to do with the system.

Alternatively, you may not worry about generalisation, if the effect you have found is important for a particular group of users, then it will be helpful for them – you have found your market!

References

[Fi54] Fitts, Paul M. (1954) The information capacity of the human motor system in controlling the amplitude of movement. Journal of Experimental Psychology, 47(6): 381-391, Jun 1954,. http://dx.doi.org/10.1037/h0055392

[HH10] Henrich J, Heine S, Norenzayan A. (2010). The weirdest people in the world? Behav Brain Sci. 2010 Jun;33(2-3):61-83; discussion 83-135. doi: 10.1017/S0140525X0999152X. Epub 2010 Jun 15.

gaining power (2) – the noise-effect-number triangle

The heart of gaining power in your studies is understanding the noise–effect–number triangle.  Power arises from a combination of the size of the effect you are trying to detect, the size of the study (number of trails/participants) and the size of the ‘noise’ (the random or uncontrolled factors). We can increase power by addressing any one of these.

Cast your mind back to your first statistics course, or when you first opened a book on statistics.

The standard deviation (sd) is one of the most common ways to measure of the variability of a data point. This is often due to ‘noise’, or the things you can’t control or measure.

For example, the average adult male height in the UK is about 5 foot 9 inches ( with a standard deviation of about 3 inches (7.5cm), most British men are between 5′ 6″ (165cm) and 6′ (180cm) tall.

However, if you take a random sample and look at the average (arithmetic mean), this varies less as typically your sample has some people higher than average, and some people shorter than average, and they tend to cancel out. The variability of this average is called the standard error of the mean (or just s.e.), and is often drawn as little ‘error bars’ on graphs or histograms, to give you some idea of the accuracy of the average measure.

You might also remember that, for many kinds of data the standard error of the mean is given by:

s.e. = σ / √n                   (or if σ is an estimate √n-1 )

For example, of you have one hundred people, the variability of the average height is one tenth the variability of a single person.

The question you then have to ask yourself is how big an effect do you want to detect? Imagine I am about to visit Denmark. I have pretty good idea that Danish men are taller than British men and would like to check this.   If the average were a foot (30cm) I definitely want to know as I’ll end up with a sore neck looking up all the time, but if it is just half an inch (1.25cm) I probably don’t care.

Let’s call this least difference that I care about δ (Greek letters, it’s a mathematician thing!), so in the example δ = 0.5 inch.

If I took a sample of 100 British men and 100 Danes, the standard error of the mean would be about 0.3 inch (~1cm) for each, so it would be touch and go if I’d be able to detect the difference. However, if I took a sample of 900 of each, then the s.e. of each average would be about 0.1 inch, so I’d probably be easily able to detect differences of 0.5 inch.

In general, we’d like the minimum difference we want to detect to be substantially bigger than the standard error of the mean in order to be able to detect the difference. That is:

δ   >> σ / √n

Note the three elements here:

  • the effect size
  • the amount of noise or uncontrolled variation
  • the number of participants, groups or trials

Although the meanings of these vary between different kinds of data and different statistical methods, the basic triad is similar. This is even in data, such as network power-law, where the standard deviation is not well defined and other measures of spread or variation apply (Remember that this is a different use of the term ‘power’). In such data it is not the square root of participants that is the key factor, but still the general rule that you need a lot more participants to get greater accuracy in measures … only for power law data the ‘more’ is even greater than squaring!

Once we understand that statistical power is about the relationship between these three factors, it becomes obvious that while increasing the number of subjects is one way to address power, it is not the only way. We can attempt to effect any one of the three, or indeed several while designing our user studies or experiments.

Thinking of this we have three general strategies:

  • increase number – As mentioned several times, this is the standard approach, and the only one that many people think about. However, as we have seen, the square root means that we often need very lareg increase in the number of subjects or trials in order to reduce the variability of our results to acceptable level. Even when you have addressed other parts of the noise–effect–number triangle, you still have to ensure you have sufficient subjects, although hopefully less than you would need by a more naïve approach.
  • reduce noise – Noise is about variation due to actors that you do not control or know about; so, we can attempt to attack either of these. First we can control conditions reducing the variability in our study; this is the approach usually take in physics and other sciences, using very pure substances, with very precise instruments in controlled environments. Alternatively, we can measure other factors and fit or model the effect of these, for example, we might ask the participants’ age, prior experience, or other things we think may affect the results of our study.
  • increase effect size – Finally, we can attempt to manipulate the sensitivity of our study. A notable example of this is the photo from the back of the crowd at President Trump’s inauguration. It was very hard to assess differences in crowd size at different events from the photos taken from the front of the crowd, but photos at the back are a far more sensitive. Your studies will probably be less controversial, but you can use the same technique. Of course, there is a corresponding danger of false baselines, in that we may end up with a misleading idea of the size of effects — as noted previously with power comes the responsibility to report fairly and accurately.

In the following two posts, we will consider strategies that address the factors of the noise–effect–number triangle in different ways. We will concentrate first on the subjects, the users or participants in our studies, and then on the tasks we give them to perform.


gaining power (1) – if there is something there, make sure you find it


Statistical power is about whether an experiment or study is likely to reveal an effect if it is present. Without a sufficiently ‘powerful’ study, you risk being in the middle ground of ‘not proven’, not being able to make a strong statement either for or against whatever effect, system, or theory you are testing.


You’ve recruited your participants and run your experiment or posted an online survey and gathered your responses; you put the data into SPSS and … not significant.   Six months work wasted and your plans for your funded project or PhD shot to ruins.

How do you avoid the dread “n.s.”?

Part of the job of statistics is to make sure you don’t say anything wrong, to ensure that when you say something is true, there is good evidence that it really is.

This is the why in traditional hypothesis testing statistics, you have such a high bar to reject the null hypothesis. Typically the alternative hypothesis is the thing you are really hoping will be true, but you only declare it likely to be true if you are convinced that the null hypothesis is very unlikely.

Bayesian statistics has slightly different kinds of criteria, but is in the end doing the same things, ensuring you down have false positives.

However, you can have the opposite problem, a false negative — there may be a real effect there, but your experiment or study was simply not sensitive enough to detect it.

Statistical power is all about avoiding these false negatives. There are precise measures of this you can calculate, but in broad terms, it is about whether an experiment or study is likely to reveal an effect if it is present. Without a sufficiently ‘powerful’ study, you risk being in the middle ground of ‘not proven’, not being able to make a strong statement either for or against whatever effect, system, or theory you are testing.

(Note the use of the term ‘power’ here is not the same as when we talk about power-law distributions for network data).

The standard way to increase statistical power is simply to recruit more participants. No matter how small the effect, if you have a sufficiently large sample, you are likely to detect it … but ‘sufficiently large’ may be many, many people.

In HCI studies the greatest problem is often finding sufficient participants to do meaningful statistics. For professional practice we hear that ‘five users are enough‘, but less often that this figure was based on particular historical contingencies and in the context of single formative iterations, not summative evaluations, which still need the equivalent of ‘power’ to be reliable.

Happily, increasing the number of participants is not the only way to increase power.

In blogs over the next week or two, we will see that power arises from a combination of:

  • the size of the effect you are trying to detect
  • the size of the study (number of trails/participants) and
  • the size of the ‘noise’ (the random or uncontrolled factors).

We will discuss various ways in which careful design, selection of subjects and tasks can increase the power of your study albeit sometimes requiring care in interpreting results. For example, using a very narrow user group can reduce individual differences in knowledge and skill (reduce noise) and make it easier to see the effect of a novel interaction technique, but also reduces generalisation beyond that group. In another example, we will also see how careful choice of a task can even be used to deal with infrequent expert slips.

Often these techniques sacrifice some generality, so you need to understand how your choices have affected your results and be prepared to explain this in your reporting: with great (statistical) power comes great responsibility!

However, if a restricted experiment or study has shown some effect, at least you have results to report, and then, if the results are sufficiently promising, you can go on to do further targeted experiments or larger scale studies knowing that you are not on a wild goose chase.

Slides for CHI2017 statistics course available at SlideShare

All the slides for the CHI 2017 course have been uploaded to SlideShare. They can be found in the relevant section of the course website, and are collected below.

There will be videos for all this material following over the summer. If there are particular topics of interest, let me know and I’ll use this to help prioritise which parts to video first.


CHI course coming soon

On Wednesday afternoon I’ll be running the “Making Sense of Statistics in HCI” course at CHI in Denver.  After a first run before Three Tech Wave, I’m cutting down the material somewhat …

If you are attending, please remember to bring 20 small coins for coin tossing experiments (US cents, Euro cents, pennies, or whatever you have).