
 You have done your experiment or study and have your data, maybe you have even done some preliminary statistics – what next, how do you make sense of the results?
This part of will looks at a number of issues and questions:
- Why are you doing it the work in the first place? Is it research or development, exploratory work, or summative evaluation?
- Eyeballing and visualising your data – finding odd cases, checking you model makes sense, and avoiding misleading diagrams.
- Understanding what you have really found – is it a deep result, or merely an artefact of an experimental choice?
- Accepting the diversity of people and purposes – trying to understand not whether your system or idea is good, but who or what it is good for.
- Building for the future – ensuring your work builds the discipline, sharing data, allowing replication or meta-analysis.
Although these are questions you can ask when you are about to start data analysis, they are also ones you should consider far earlier. One of the best ways to design a study is to imagine this situation before you start!.
When you think you are ready to start recruiting participants, ask yourself, “if I have finished my study, and the results are as good as I can imagine, so what? What do I know?” – it is amazing how often this leads to a complete rewriting of a survey or experimental redesign.
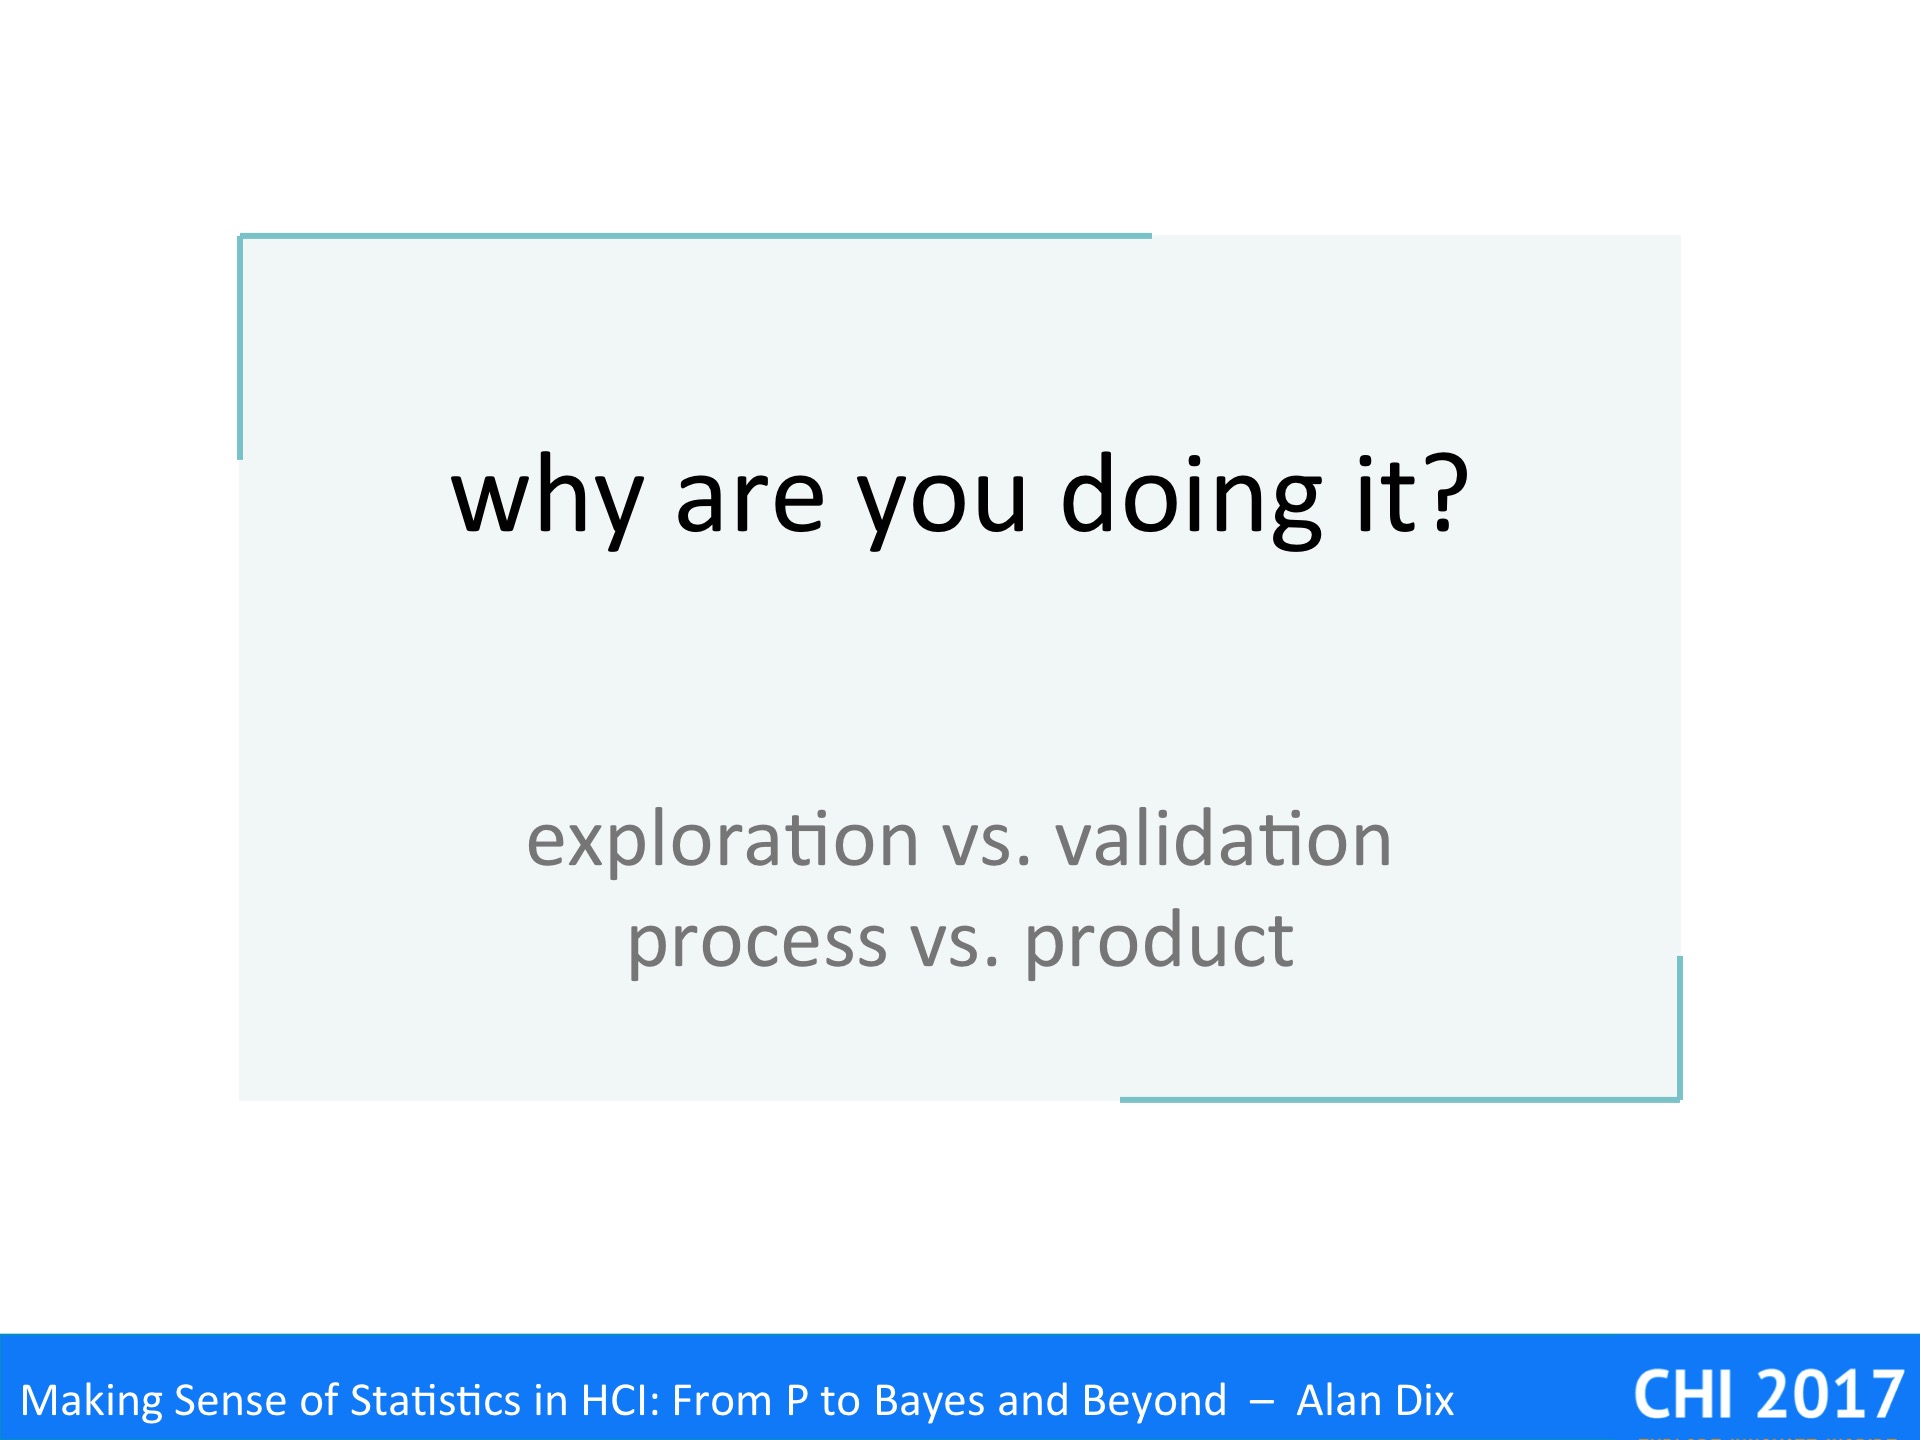
Are you doing empirical work because you are an academic addressing a research question, or a practitioner trying to design a better system? Is your work intended to test an existing hypothesis (validation) or to find out what you should be looking for (exploration)? Is it a one-off study, or part of a process (e.g. ‘5 users’ for iterative development)?
These seem like obvious questions, but, in the midst of performing and analysing your study, it is surprisingly easy it is to lose track of your initial reasons for doing it. Indeed, it is common to read a research paper where the authors have performed evaluations that are more appropriate for user interface development, reporting issues such as wording on menus rather than addressing the principles that prompted their study.
This is partly because there are similarities, in the empirical methods used, and also parallels between stages of each. Furthermore, your goals may shift – you might be in the midst of work to verify a prior research hypothesis, and then notice and anomaly in the data, which suggests a new phenomenon to study or a potential idea for a product.
We’ll start out by looking at the research and software-development processes separately, and then explore the parallels.
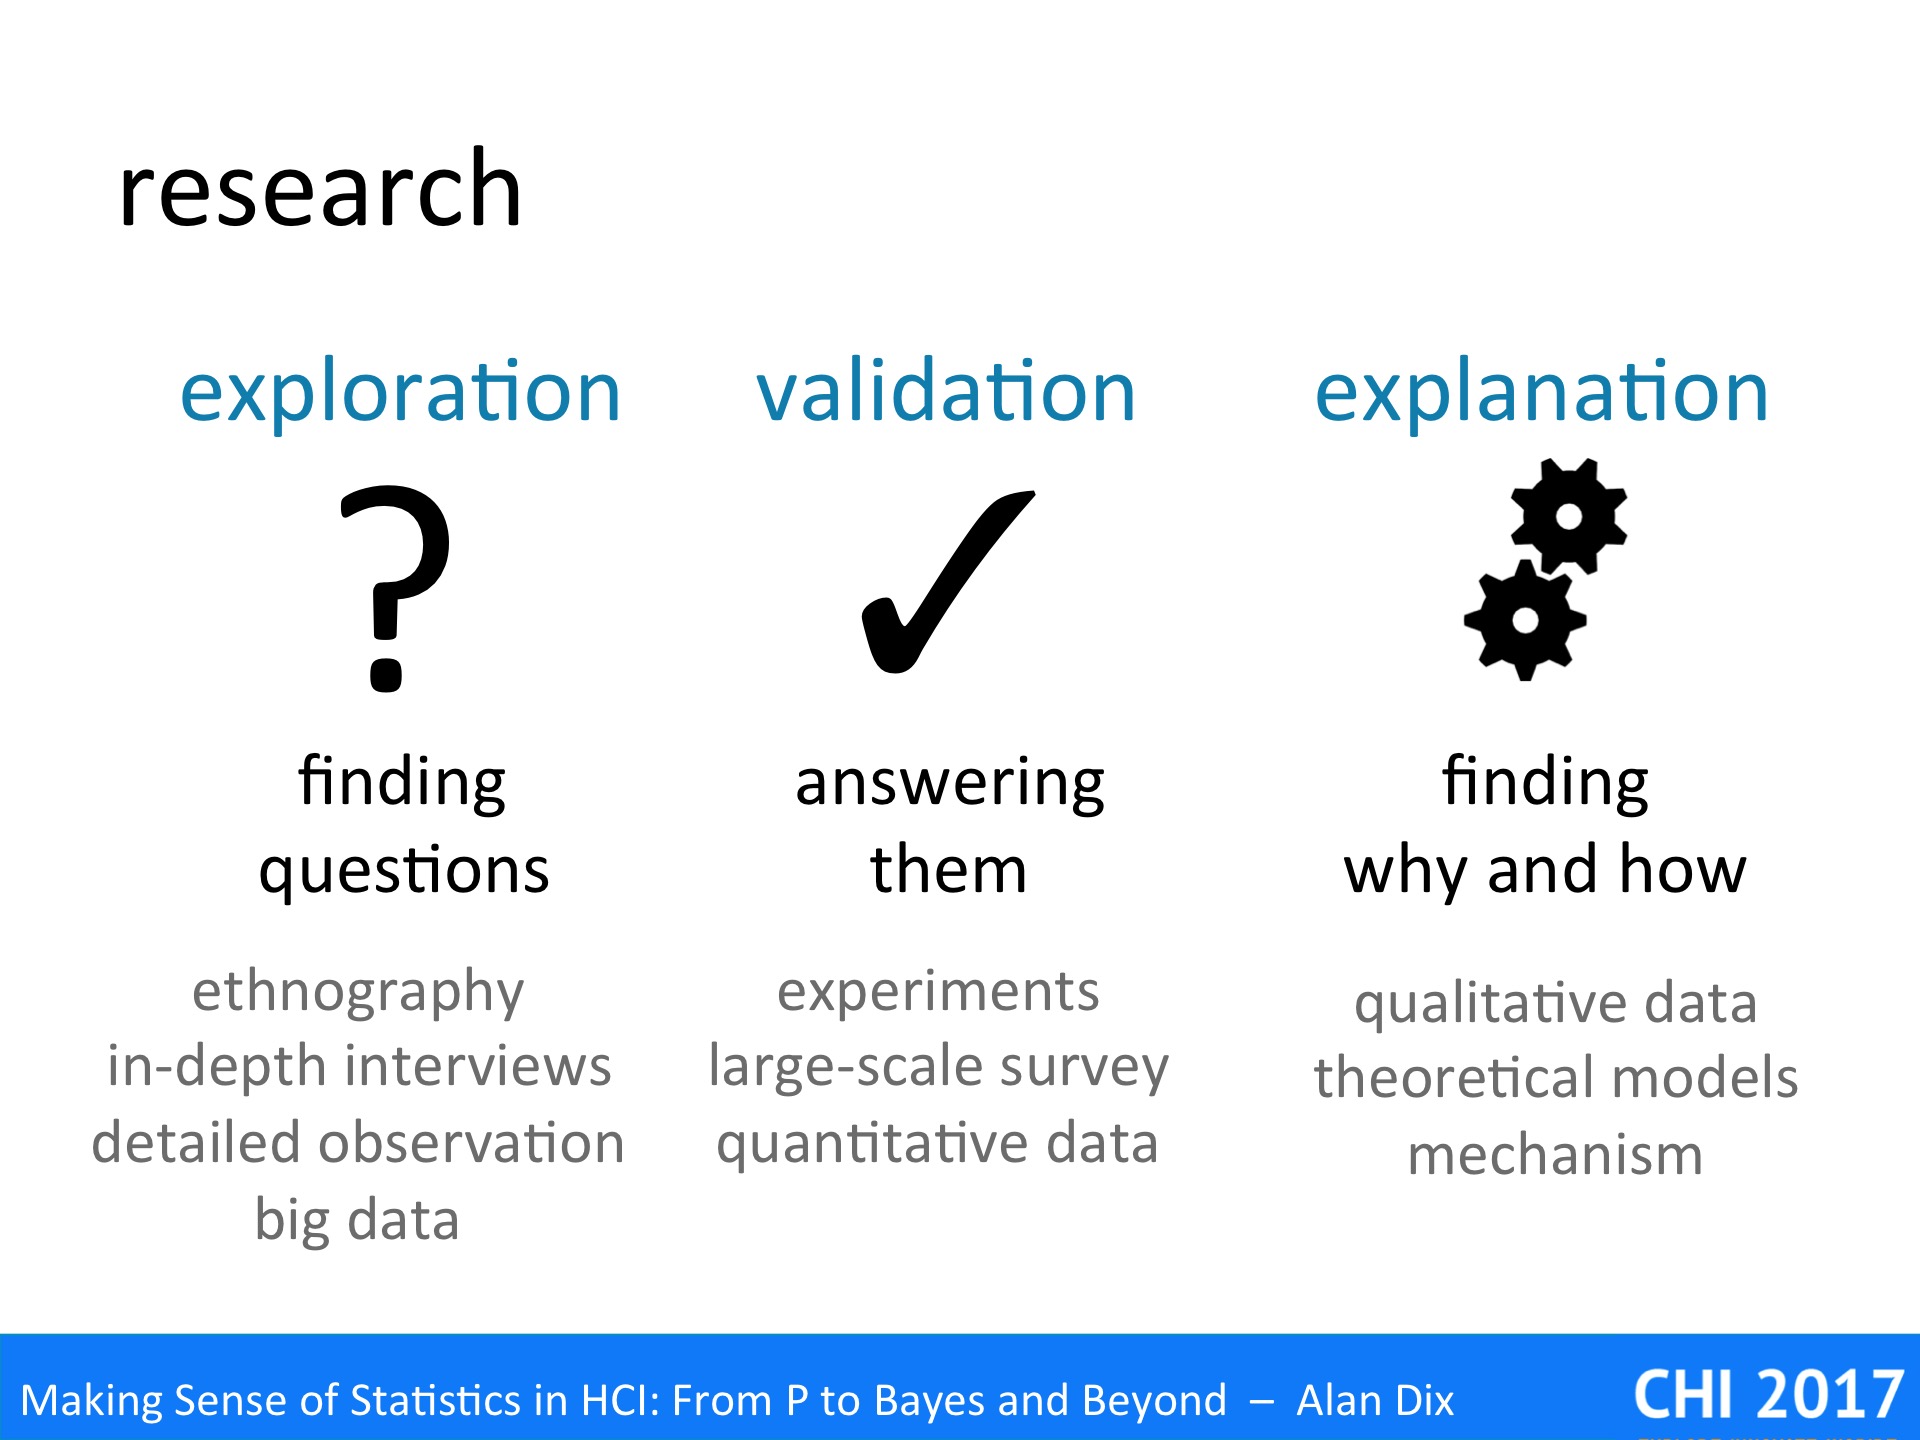
There are three main uses of empirical work during research, which often relate to the stages of a research project:
exploration – This is principally about identifying the questions you want to ask. Techniques for exploration are often open-ended. They may be qualitative: ethnography, in-depth interviews, or detailed observation of behaviour whether in the lab or on the wild. However, this is also a stage that might involve (relatively) big data, for example, if you have deployed software with logging, or have conducted a large scale, but open ended, survey. Data analysis may then be used to uncover patterns, which may suggest research questions. Note, you may not need this as a stage of research if you come with an existing hypothesis, perhaps from previous phases of your own research, questions arising form other published work, or based on your own experiences.
validation – This is predominantly about answering questions or verifying hypotheses. This is often the stage that involves most quantitative work: including experiments or large-scale surveys. This is the stage that one most often publishes, especially in terms of statistical results, but that does not mean it is the most important. In order to validate, you must establish what you want to study (explorative) and what it means (explanation).
explanation – While the validation phase confirms that an observation is true, or a behaviour is prevalent, this stage is about working out why it is true, and how it happens in detail. Work at this stage often returns to more qualitative or observational methods, but with a tighter focus. However, it may also me more theory based, using existing models, or developing new ones in order to explain a phenomenon. Crucially it is about establishing mechanism, uncovering detailed step-by-step behaviours … a topic we shall return to later.
Of course these stages may often overlap and data gathered for one purpose may turn out to be useful for another. For example, work intended for validation or explanation may reveal anomalous behaviours that lead to fresh questions and new hypothesis. However, it is important to know which you were intending to do, and if you change when and why you are looking at the data differently … and if so whether this matters.
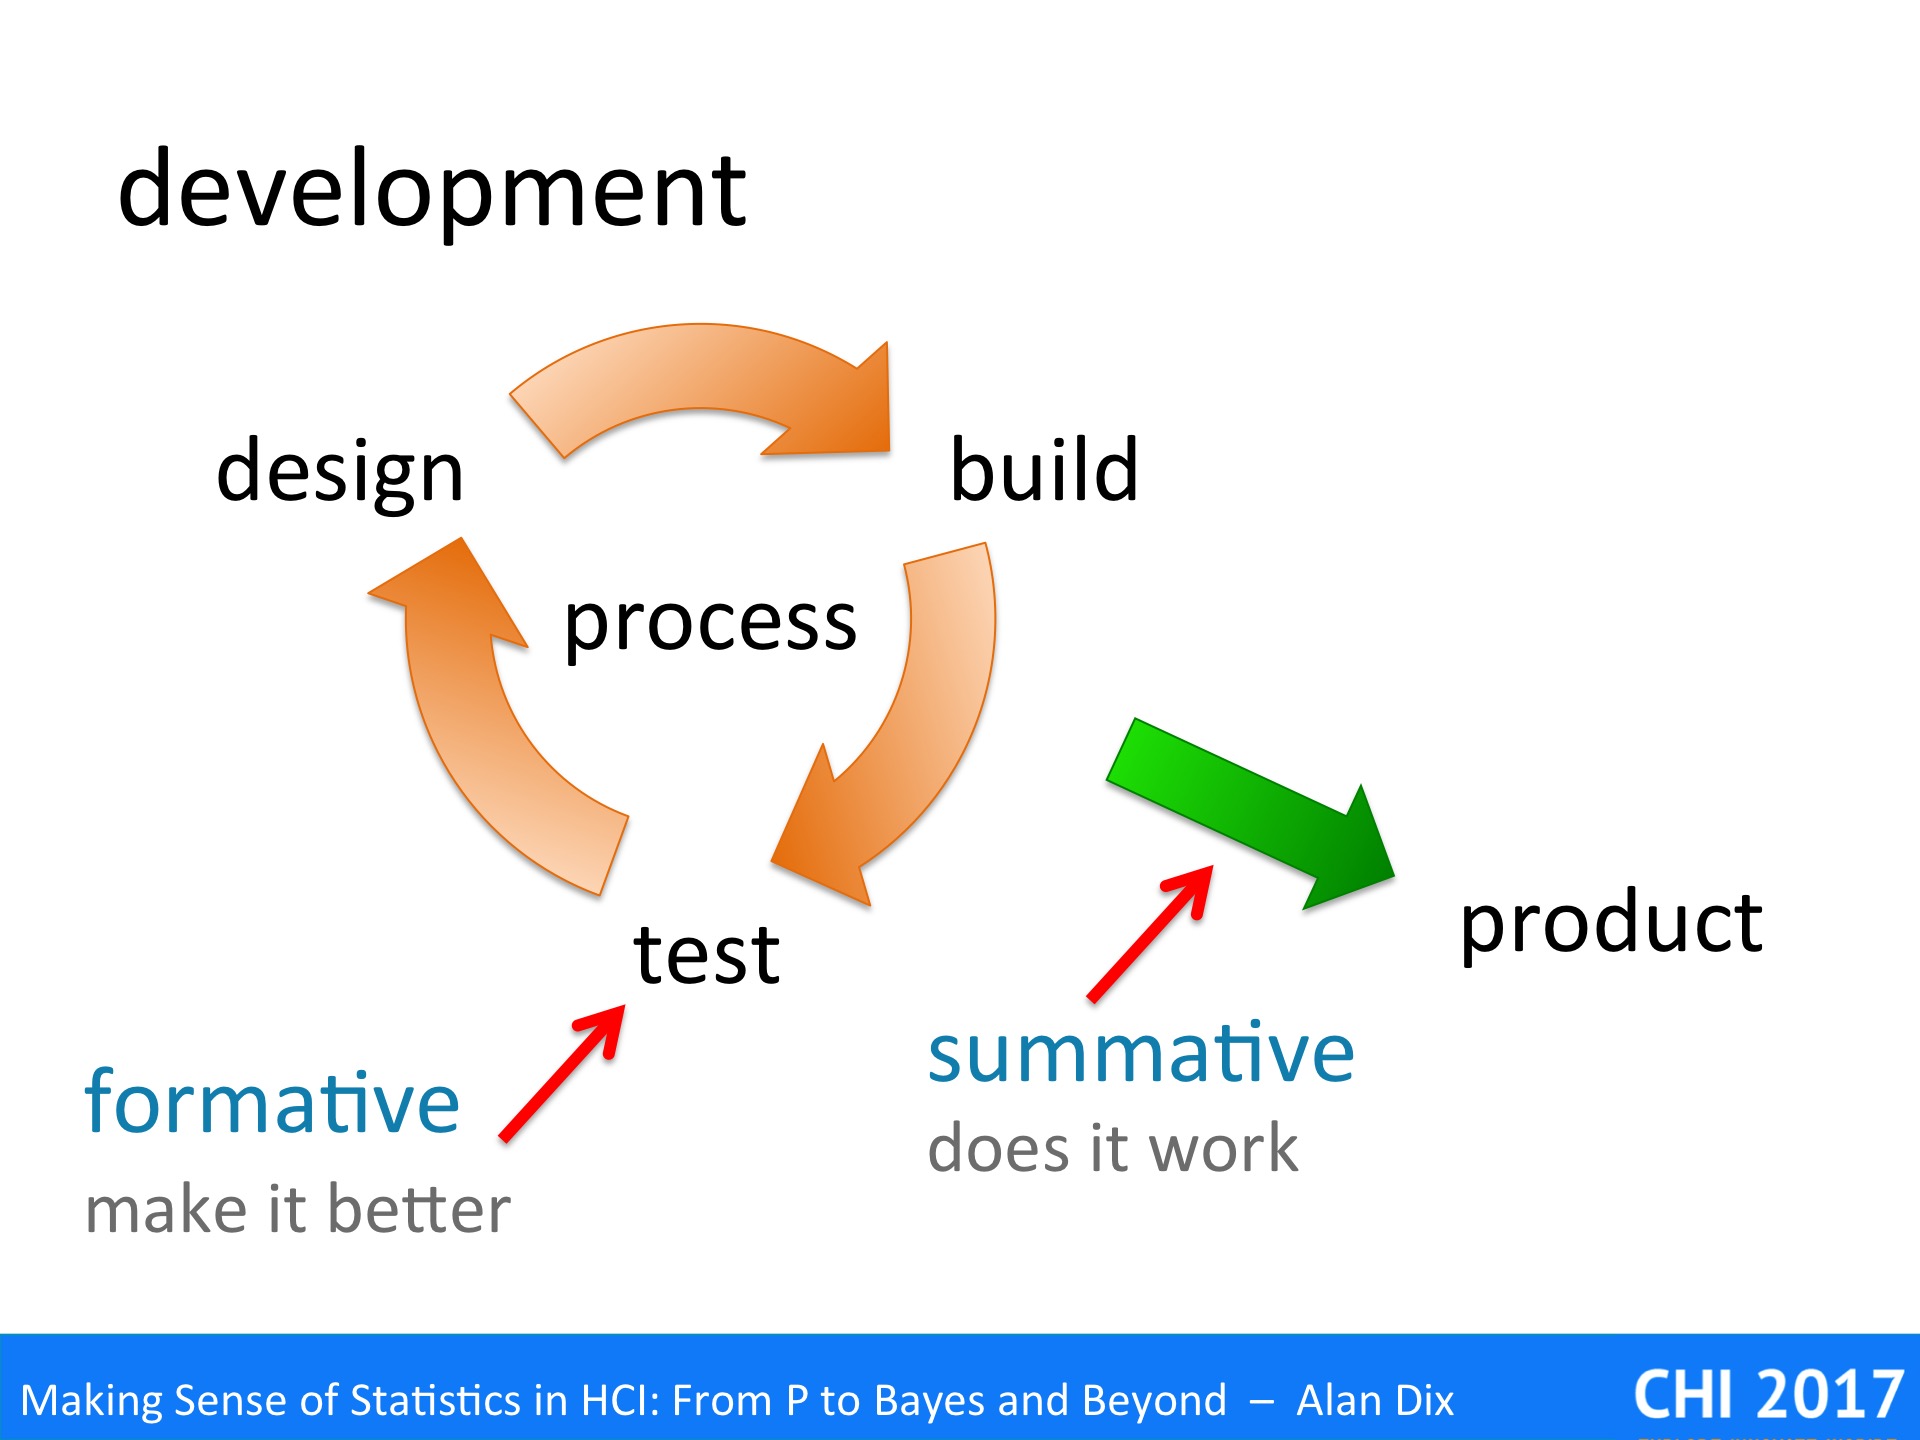
During iterative software development and user experience design, we are used to two different kinds of evaluation:
formative evaluation – This is about making the system better. This is performed on prototypes or experimental systems during the cycles of design–build–test. The primary purpose of formative evaluation is to uncover usability or experience problems for the next cycle.
summative evaluation – This is about checking that the systems works and is good enough. It is performed at the end of the software development process on a pre-release product. IT may be related to contractual obligations: “95% of users will be able to use the product for purpose X after 20 minutes training”; or may be comparative: “the new software outperforms competitor Y on both performance and user satisfaction”.
In web applications, the boundaries can become a little less clear as changes and testing may happen on the live system as part of perpetual-beta releases or A–B testing.

Although research and software development have different overall goals, we can see some obvious parallels between the two. There are clear links between explorative research and formative evaluations, and between validation and summative evaluations. Although, it is perhaps less clear immediately how explanatory research connects with development.
We will look at each in turn.

During the exploration stage of research or during formative evaluation of a product, you are interested in finding any interesting issue. For research this is about something that you may then go on to study in depth and, hopefully, publish papers about. In software development tis is about finding usability problems to fix or identifying opportunities for improvements or enhancements.
It does not matter whether you have fond the most important issue, or the most debilitating bug, so long as you have found sufficient for the next cycle of development.
Statistics are less important at this stage, but may help you establish priorities. If costs or time is short, you may need to decide out of the issues you have uncovered, which is most interesting to study further, or fix first.
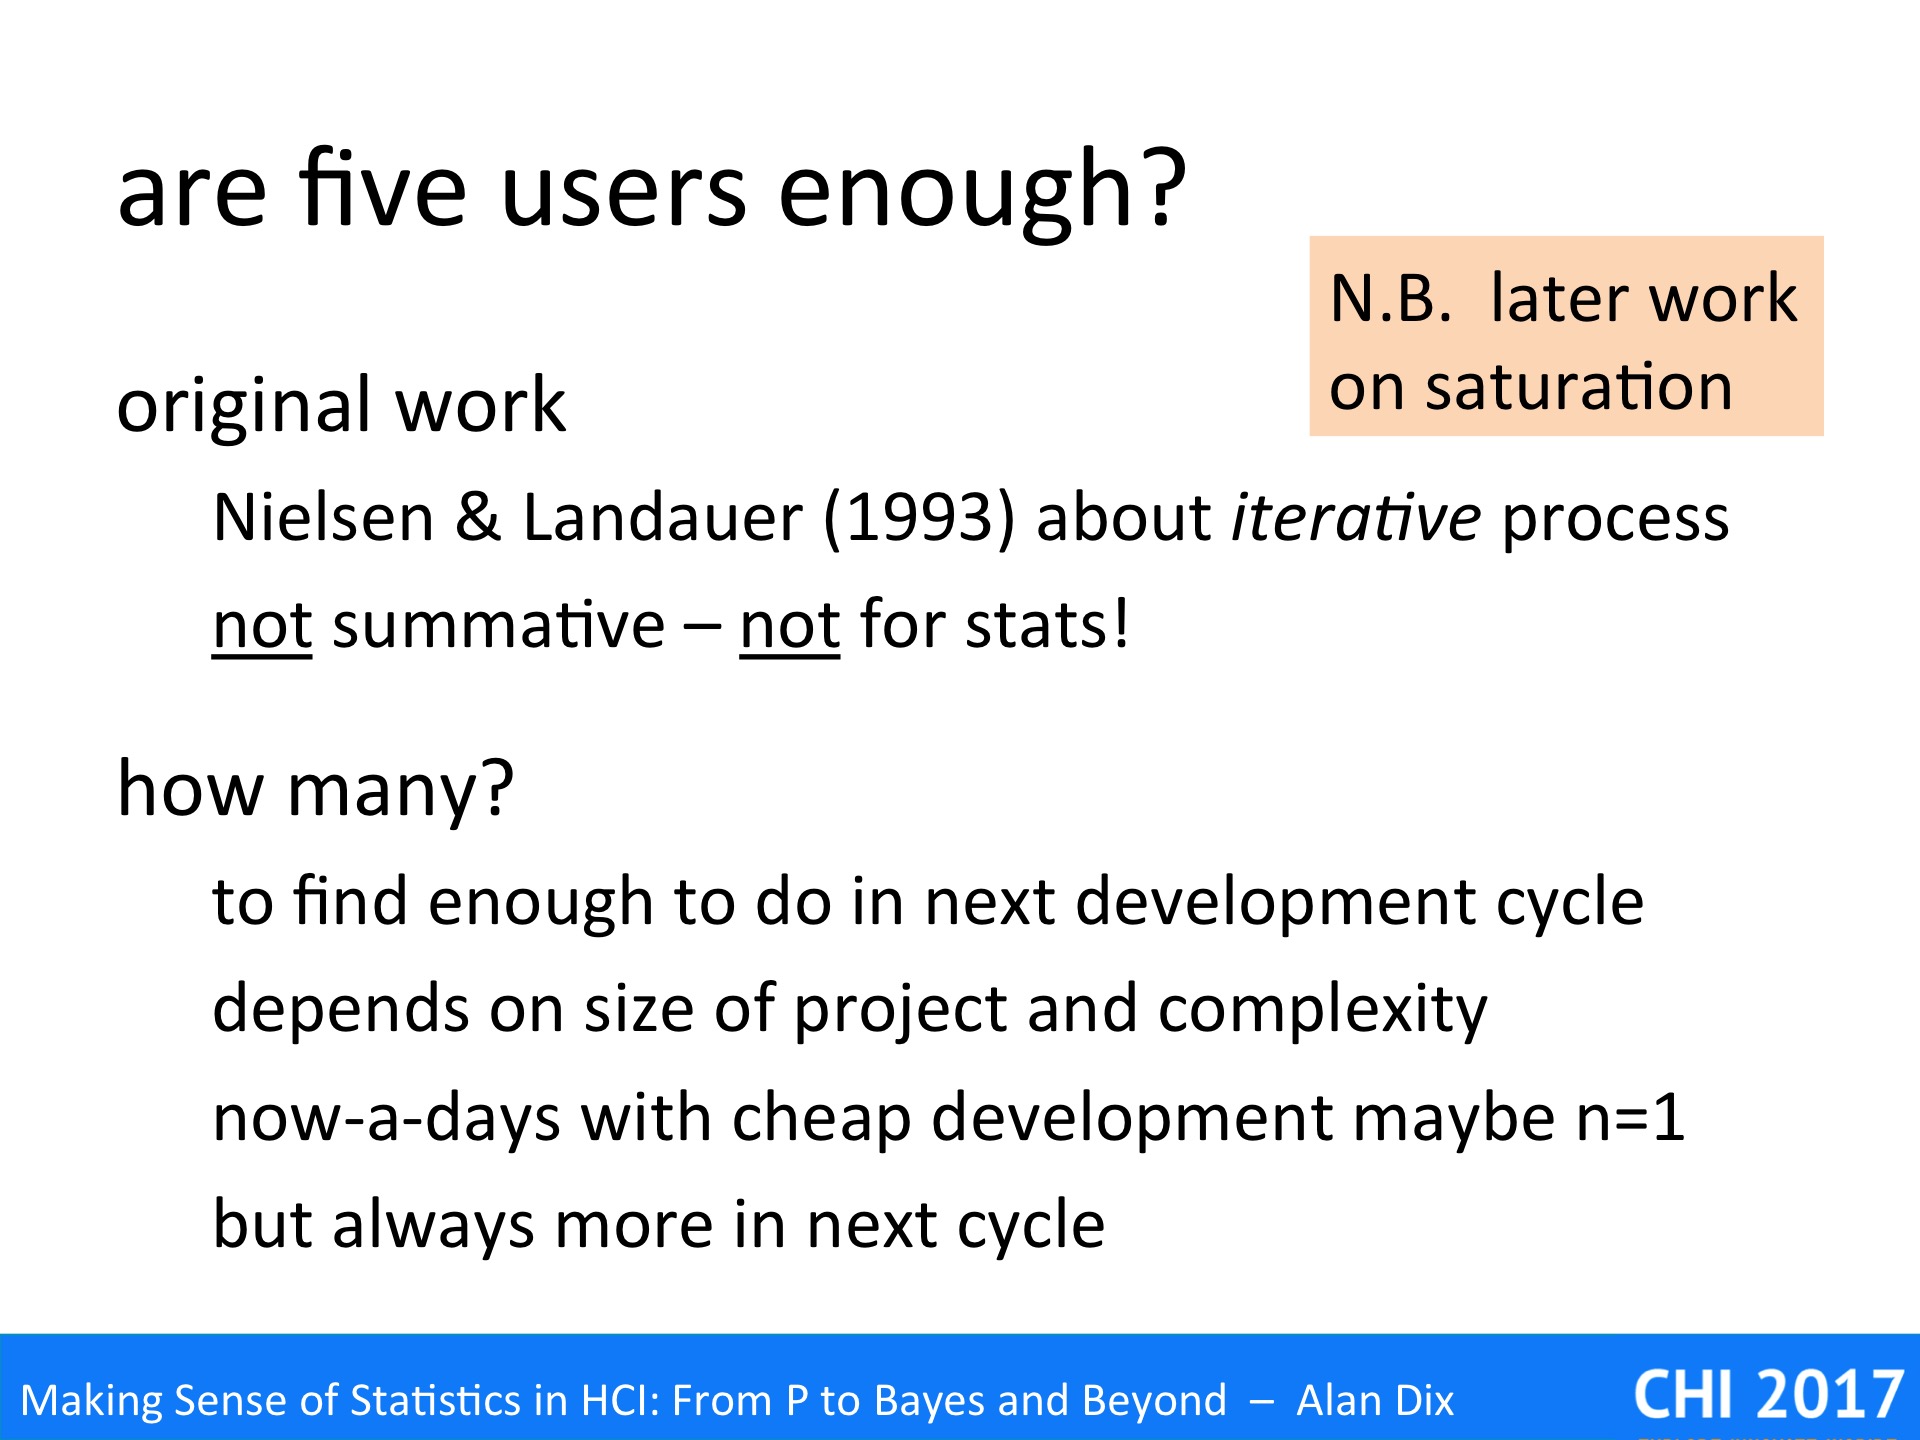
One of the most well known (albeit misunderstood ) myths of interaction design is the idea that five users are enough.
The source of this was Nielsen and Landaur’s original paper [NL93], nearly twenty-five years ago. However, this was crucially about formative evaluation during iterative evaluation.
I emphasise it was NOT about either summative evaluation, not about sufficient numbers for statistics!
Nielsen and Landaur combined a simple theoretical model based on software bug detection with empirical data from a small number of substantial software projects to establish the optimum number of users to test per iteration.
Their notion of ‘optimum’ was based on cost-benefit analysis: each cycle of development cost a certain amount, each user test cost a certain amount. If you uncover too few user problems in each cycle you end up with lots of development cycles, which is expensive in terms of developer time. However, if you perform too many user tests you end up finding the same problems, thus wasting user-testing effort.
The optimum value depended on the size and complexity of the project, with the number higher for more complex projects, where redevelopment cycles were more costly, and the figure of five was a rough average.
Now-a-days, with better tool support, redevelopment cycles are far less expensive than any of the projects in the original study, and there are arguments that the optimal value now may even be just testing one user [MT05] – especially if it is obvious that the issues uncovered are ones that appear likely to be common.
However, whether one, five or twenty user, there will be more users on the next iteration – this is not about the total number of users tested during development. In particular, at later stages of development, when the most glaring problems have been sorted, it will become more important to ensure you have covered a sufficient range of the
For more on this see Jakob Neilsen’s more recent and nuanced advice [Ni12] and my own analyses of “Are five users enough?” [Dx11].

In both validation in research and summative evaluation during development, the focus is much more exhaustive: you want to find all problems, or issues (hopefully not many left during summative evaluation!).
The answers you need are definitive, you are not so much interested in new directions (although this may be an accidental outcome), but instead verifying that your precise hypothesis is true, or that the system works as intended. For this you may need statistical test, whether traditional (p value) or Baysian (odds ratio).
You may also be after numbers: how good is it (e.g., “nine out of ten owners say their cats prefer …”), how prevalent is an issue (e.g., “95% of users successfully use the auto-grow feature”). For this the size of effects are important, so you may me more interested in confidence intervals, or pretty graphs with error bars on them.
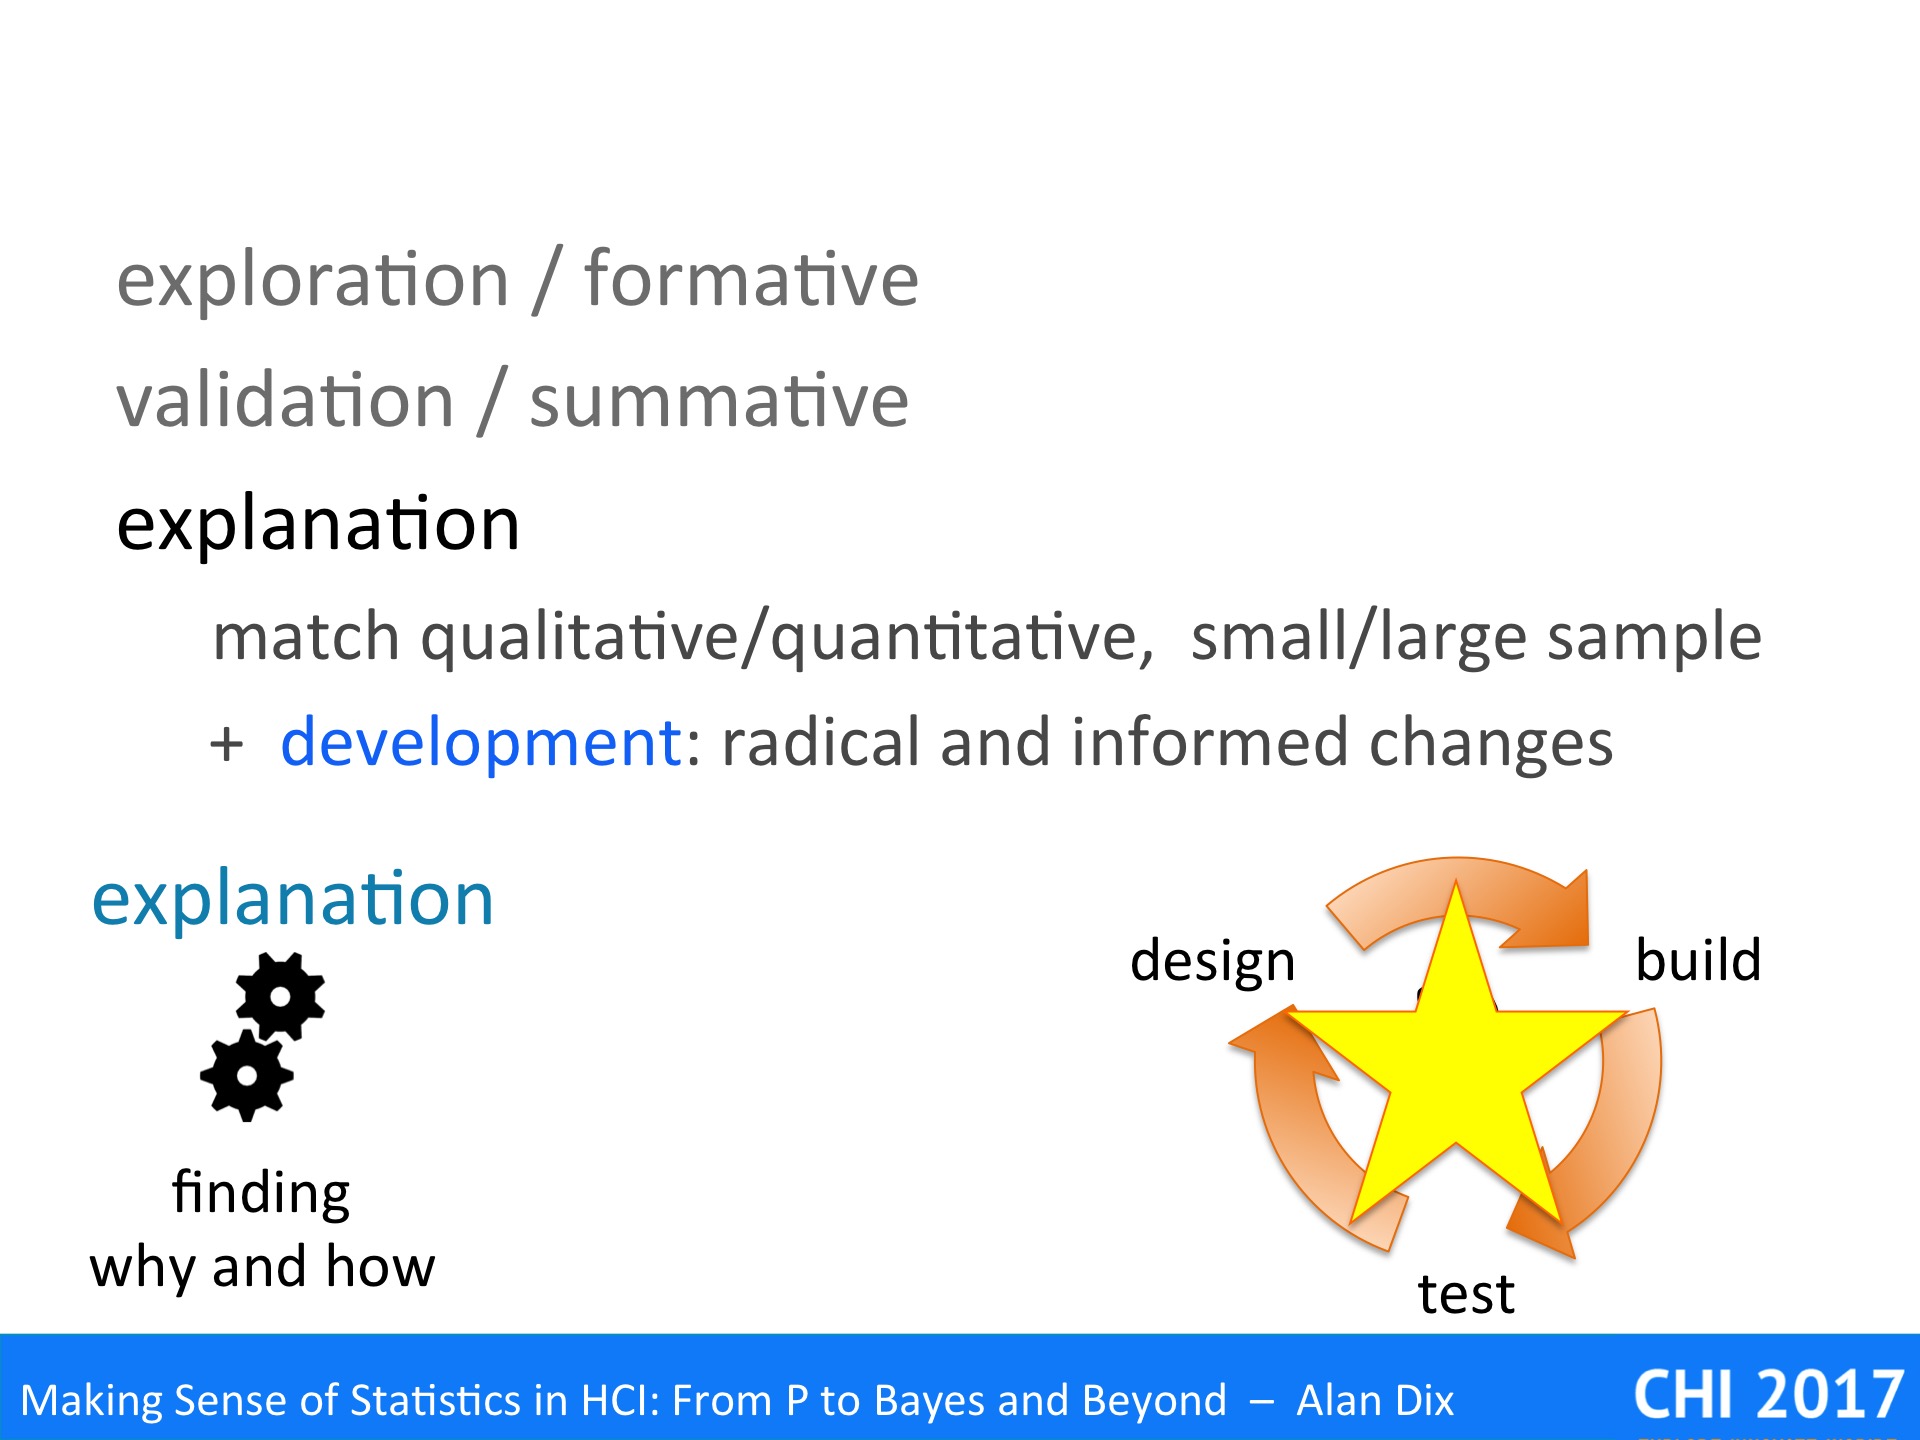
While validation establishes that a phenomenon occurs, what is true, explanation tries to work out why it happens and how it works – deep understanding.
As noted this will often involve more qualitative work on small samples of people, but often connecting with quantitative studies of large samples.
For example, you might have a small number of rich in-depth interviews, but match the participants against the demographics of large-scale surveys. Say that a particular pattern of response is evident in the large study. If your in-depth interviewee has a similar response, then it is often a reasonable assumption their their reasons will be similar to the large sample. Of course they could be just saying the same thing, but for completely different reasons, but often commons sense, or prior knowledge means that the reliability is evident. Of course, if you are uncertain f the reliability of the explanation, this could always drive targeted questions in a further round of large-scale survey.
Similarly, if you have noticed a particular behaviour in logging data from a deployed experimental application, and a user has the same behaviour during a think aloud session or eye-tracking session, then it is reasonable to assume that the deliberations, cognitive or perceptual behaviours may well be the same as in the users of the deployed application.
We noted that the parallel with software development was less obvious, however the last example, starts to point towards this.
During the development process, often user testing reveals many minor problems. It iterates towards a good-enough solution … but rarely makes large scale changes. Furthermore, at worst, the changes you perform at each cycle may create new problems. This is a common problem with software bugs, code becomes fragile, but also with user interfaces, where each change in the interface creates further confusion, and may not even solve the problem that gave rise to it. After a while you may lose track of why each feature is there at all.
Rich understanding the underlying human processes: perceptual, cognitive, social, can both make sure that ‘bug fixes’ actually solve the problem, Furthermore, it allows more radical, but informed redesign that may make whole rafts of problems simply disappear.
References
[Dx11] Dix, A. (2011) Are five users enough? HCIbook online! http://www.hcibook.com/e3/online/are-five-users-enough/
[MT05] Marty, P.F. & Twidale, M.B. (2005). Extreme Discount Usability Engineering. Technical Report ISRN UIUCLIS–2005/1+CSCW. http://citeseerx.ist.psu.edu/viewdoc/summary?doi=10.1.1.74.3702
[NL93] Nielsen, J. and Landauer, T. (1993). A mathematical model of the finding of usability problems. INTERACT/CHI ’93. ACM, 206–213.
[Ni12] Nielsen, J (2012). How Many Test Users in a Usability Study? NN/g Norman–Nielsen Group, June 4, 2012. https://www.nngroup.com/articles/how-many-test-users/