
 Hypothesis testing is still the most common use of statistics – using various measures to come up with a p < 5% result.
In this video we’ll look at what this 5% (or 1%) actual means, and as important what it does not mean. Perhaps even more critically, is understanding what you can conclude from a non-significant result and in particular remembering that it means ‘not proven’ NOT ‘no effect’!
The language of hypothesis testing can be a little opaque!
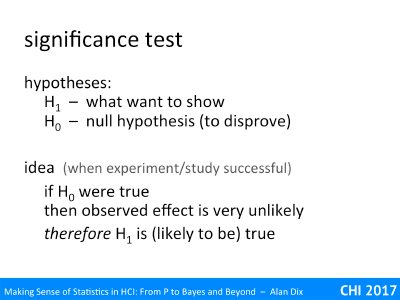
A core term, which you have probably seen, is the idea of the null hypothesis, also written H0, which is usually what you want to disprove. For example, it may be that your new design has made no difference to error rates.
The alternative hypothesis, written H1, is what you typically would like to be true.
The argument form is similar to proof by contradiction in logic or mathematics. In this you assert what you believe to be false as if it were true, reason from that to something that is clearly contradictory, and then use that to say that what you first assumed must be false.
In statistical reasoning of course you don’t know something is false, just that it is unlikely.
The hypothesis testing reasoning goes like this:
if the null hypothesis H0 were true
then the observations (measurements) are very unlikely
therefore the null hypothesis H0 is (likely to be) false
and hence the alternative H1 is (likely to be) true
For example, imagine our null hypothesis is that a coin is fair. You toss it 100 times and it ends up a head every time. The probability of this given a fair coin (likelihood) is 1/2100 that is around 1 in a nonillion (1 with 30 zeros!). This seems so unlikely, you begin to wonder about that coin!
Of course, most experiments are not so clear cut as that.
You may have heard of the term significance level, this is the threshold at which you decide to reject the null hypothesis. In the example above, this was 1 in a nonillion, but that is quite extreme.
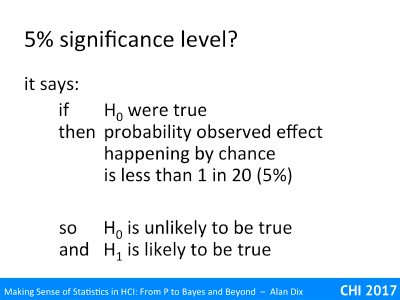
The smallest level that is normally regarded as reasonable evidence is 5%. This means that if the likelihood of the null hypothesis (probability of the observation given H0) is less than 5% (1 in 20), you reject it and assume the alternative must be true.
Let’s say that our null hypothesis was that your new design is no different to the old one. When you tested with six users all the users preferred the new design.
The reasoning using a 5% significance level as a threshold would go:
if the null hypothesis H0 is true (no difference)
then the probability of the observed effect (6 preference)
happening by chance
is 1/64 which is less than 5%
therefore reject H0 as unlikely to be true
and conclude that the alternative H1 is likely to be true
Yay! your new design is better 🙂
Note that this figure of 5% is fairly arbitrary. What figure is acceptable depends on a lot of factors. In usability, we will usually be using the results of the experiment alongside other evidence, often knowing that we need to make adaptations to generalise beyond the conditions. In physics, if they conclude something is true, it is taken to be incontrovertibly true, so they look for a figure more like 1 in 100,000 or millions.
Note too that if you take 5% as your acceptable significance level, then if your system were no better there would still be a 1 in 20 chance you would conclude it was better – this is called a type I error (more stats-speak!), or (more comprehensibly) a false positive result.
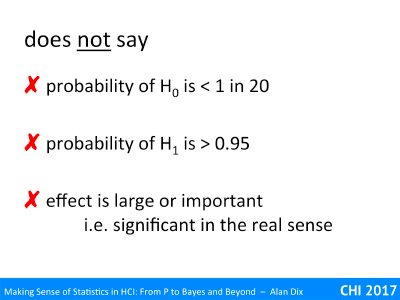
Note also that a 5% significance does NOT say that the probability of the null hypothesis is less than 1 in 20. Think about the coin you are tossing, it is either fair or not fair, or think of the experiment comparing your new design with the old one: your design either is or is not better in terms of error rate for typical users.
Similarly it does not say the probability of the alterative hypothesis (your system is better) is > 0.95. Again it either is or is not.
Nor does it say that the difference is important. Imagine you have lots and lots of participants in an experiment, so many that you are able to distinguish quite small differences. The experiment showed, with a high degree of statistical significance (maybe 0.1%), that users perform faster with your new system than the old one. The difference turns out to be 0.03 seconds over an average time of 73 seconds. The difference is real and reliable, but do you care?
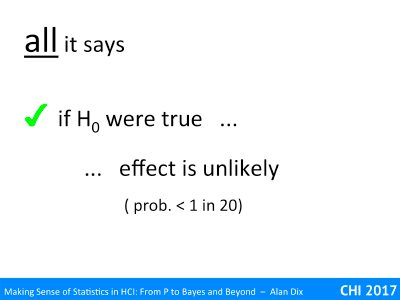
All that a 5% significance level says is that is the null hypothesis H0 were true, then the probability of seeing the observed outcome by chance is 1 in 20.
Similarly for a 1% levels the probability of seeing the observed outcome by chance is 1 in 100, etc.
Perhaps the easiest mistake to make with hypothesis testing is not when the result is significant, but when it isn’t.
Say you have run your experiment comparing the old system with the new design and there is no statistically significant difference between the two. Does that mean there is not difference?
This is a possible explanation, but it also may simply mean your experiment was not good enough to detect the difference.
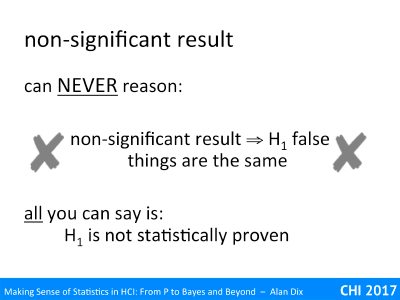
Although you do reason that significant result means the H0 is false and H1 (the alternative) is likely to be true, you cannot do the opposite.
You can NEVER (simply) reason: non-significant result means H0 is true / H1 is false.
For example, imagine we have tossed 4 coins and all came up heads. If the coin is fair the probability of this happening is 1 in 16, this is not <5%, so even with the least strict level, this is not statistically significant. However, this was the most extreme result that was possible given the experiment, tossing 4 coins could never give you enough information to reject the null hypothesis of a fair coin!
Scottish law courts can return three verdicts: guilty, not guilty or not proven. Guilty means the judge or jury feels there is enough evidence to conclude reasonably that the accused did the crime (but of course still could be wrong) and not guilty means they are reasonably certain the accused did not commit the crime. The ‘not proven’ verdict means that the judge or jury simply does not feel they have sufficient evidence to say one way or the other. This is often the verdict when it is a matter of the victim’s word versus that of the accused, as is frequently happens in rape cases.
Scotland is unusual in having the three classes of verdict and there is some debate as to whether to remove the ‘not proven’ verdict as in practice both ‘not proven’ and ‘not guilty’ means the accused is acquitted. However, it highlights that in other jurisdictions ‘not guilty’ includes both: it does not mean the court is necessarily convinced that the accused is innocent, merely that the prosecution has not provided sufficient evidence to prove they are guilty. In general a court would prefer the guilty walk free than the innocent are incarcerated, so the barrier to declaring ‘guilty’ is high (‘beyond all reasonable doubt’ … not p<5%!), so amongst the ‘not guilty’ will be many who committed a crime as well as many who did not.
In statistics ‘not significant’ is just the same – not proven.
In summary, all a test of statistical significance means is that if the null hypothesis (often no difference) is true, then the probability of seeing the measured results is low (e.g. <5%, or <1%). This is then used as evidence against the null hypothesis. It is good to return to this occasionally, but for most purposes an informal understanding is that statistical significance is evidence for the alterative hypothesis (often what you are trying to show), but maybe wrong – and the smaller the % or probability the more reliable the result. However, all that non-significance means is not proven.