
 Traditional statistics and Bayesian methods have their own specific pitfalls to avoid: for example interpretation of non-significant as no effect in traditional stats and confirmation bias for Bayesian stats.
They also have some common potential pitfalls. Perhaps the worst is cherry picking – doing analysis using different tests, and statistics, and methods until you find one that ‘works’! You also have to be careful of inter-related factors such as the age and experience of users. By being aware of these dangers one can hopefully avoid them!
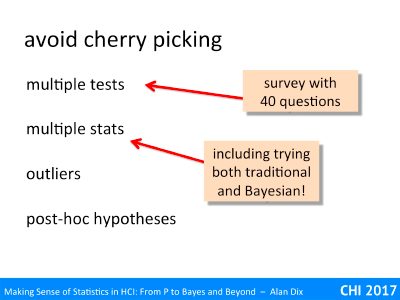
One of the most common problems in statistics are forms of ‘cherry picking’, this is when you ignore results that for some reason are not to your liking and instead just report those that are advantageous. This may be a deliberate attempt to deceive, but more commonly is simply a combination of ignorance and bias. In hypothesis testing people talk about ‘p=hacking’, but this can equally be a problem for Bayesian statistics or confidence intervals.
multiple tests
The most obvious form of cherry picking is when you test loads and loads of things and then pick out the few that come out showing some effect (p value or odds ratio) and ignoring the rest, or even worse the few that come out showing the effect you want and ignoring the ones that point the opposite way!
A classic example of this is when you have a questionnaire administered after a user test, or remotely. You have 40 questions comparing two versions of a system (A and B) in terms of satisfaction, and the questions cover different aspects of the system and different forms of emotional response. Most of the questions come out mixed between the two systems, but three questions seem to show a marked preference for the new system. You then test these using hypothesis testing and find that all three are statistically significant at 5% level. You report these and feel you have good evidence that system B is better.
But hang on, remember the meaning of 5% significance is that there is a 1 in 20 chance of seeing the effect by sheer chance. So, if you have 40 questions and there is no real difference, then would you might expect to see, on average, 2 hits at this 1 in 20 level, sometimes just 1, sometimes 3 or more. In fact there is an approximately one in three chance that you will have 3 or more apparently ‘5% significant’ results with 40 questions.
The answer to this is that if you would have been satisfied with a 5% significance level for a single test and have 10 tests, then any single one needs to be at the 0.5% significance level (5% / 10) in order to correct for the multiple tests. If you have 40 questions, this means we should look for 0.125% or p<0.00125.
This dividing the target p level by the number of tests is called the Bonferroni correction. It is very slightly conservative and there are slightly more exact versions, but for most purposes this is sufficiently accurate..
multiple stats
A slightly less obvious form of cherry picking is when you try different kinds of statistical technique. First you try a non-parametric test, then a t-test, etc., until something comes out right.
I have seen one paper where all the statistics were using traditional hypothesis testing, and then in the middle there was one test that used Bayesian statistics. There was no explanation and my best bet was they the hypothesis testing had come out negative so they had a go with Bayesian and it ‘worked’.
This use of multiple kinds of statistics is not usually quite as bad as testing lots of different things as it is the same data so the test are not independent, but if you decide to swop the statistics you are using mid-analysis, you need to be very clear why your are doing it.
It may be that you have realised that you were initially using the wrong test, for example, you might have initially used a test, such as Student’s t, that assumes normally distributed data, but only after starting the analysis realise this is not true of the data. However, simply swopping statistics part way through in the hope tat ‘something will come out’ is just a form of fishing expedition!
For Bayesian stats the choice of prior can also be a form of cherry picking if you try one and then another, until you get the result you want.
outliers
A few outliers, that is extreme values, can have a disproportionate effect on some statistics, notably arithmetic mean and variance. They may be due to a fault in equipment, or some other irrelevant effect, or may simply occur by chance.
If they do appear to be valid data points that just happen to be extreme, there is an argument for just letting them be as they are part of the random nature of the phenomenon you are studying. However, for some purposes, one gets better results by removing the most extreme outliers.
However, this can add a cherry picking potential. Ne of the largest effects of removing outliers is to reduce the variance of the sample, and a large sample variance reduces the likelihhod of getting a statistically significant effect, so there is a temptation to strip out outliers until the stats come out right.
Ideally you should choose a strategy for dealing with outliers before you do your analysis. For example, some analysis choose to remove all data that lies more than 2 or 3 standard deviations from the mean. However, there are times when you don’t realise outliers are likely to be a problem until they occur. When this happens you should attempt to be as blind to the stats as possible as you choose which outliers to remove, do avoid removing a few re-testing, removing a few more then re-testing again!
post-hoc hypothesis
The final kind of cherry picking to beware of is post-hoc hypothesis testing.
You gather your data, visualise it (good practice), and notice an interesting pattern, perhaps a correlation between variables and then test for it.
This is a bit like doing multiple test, but with an unspecified number of alterative tests. For example, if you have 40 questions, then there are 780 different possible correlations, so if you happen to notice one and then test for it, this is a bit like doing 780 tests!
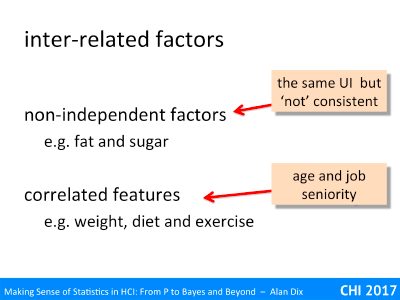
Another potential danger is where the factors you are trying to control for or measure are in some way inter-related making it hard to interpret results, especially potential causes for observed effects.
non-independently controllable factors
Sometimes you cannot change one parameter without changing others as well.
For example, if you are studying diet and try to reduce sugar intake, then it is likely that either fat intake will go up to compensate or overall calorie intake will fall. You can’t reduce sugar without something else changing.
This often happens with user interface properties or features.
For example imagine you find people are getting confused by the underline option on a menu, so you change it so the menu item says ‘underline’ when the text is not underlined, and ‘remove underline’ when it is already underlined. This may improve the underline feature, but then maybe users are confused because it still says ‘italic’ when the selected text is already italicised.
Similarly, imagine trying to take a system and make a version that is ‘not consistent’ but otherwise identical. In practice once you change one things, you need to change many others to make a coherent design.
The effect fo this is that you cannot simply say, in the diet example “reducing sugar has this effect”, but instead it is more likely to be “reducing sugar whilst keeping the rest of the diet fixed 9and hence reducing calories …” or “reducing sugar whilst keeping calorie intake constant (and hence probably increasing fact) …”.
In the menu example, you probably can’t just study the effects of the underline / remove underline menu options without changing all menu items, and hence will e studying constant name vs. state-based action naming, or something like that.
correlated features
A similar problem can occur with features of you users which you cannot directly control at all.
Let’s start again with a dietary example. Imagine you have clinical measures of health, perhaps cardiovascular tests results, and want to work out what factors in day-to-day life contribute to health, so you administer a life-style questionnaire. One question is about the amount of exercise they take and you find this correlates positively with cardio-vascular health, that s good. However, it maybe that someone who is a little overweight is less likely to take exercise, or vice versa. The different lifestyle traits: healthy diet, weight, exercise are likely to be correlated and thus it can be difficult to disentangle which are the casual factors for measured effects.
In a user interface setting we might have found that more senior managers work best with slightly larger fonts than their juniors. Maybe you surmise that this might be something to do with the high level of multi-tasking and the need for ‘at a glance’ information. However, on the whole those in more senior positions tend to be older than those in more junior positions, so that the preference is more to do with age-related eyesight problems.