Ramesh Ramloll recently posted on Facebook about two apparently contradictory news reports on vitamin D, one entitled “Recommendation for vitamin D intake was miscalculated, is far too low, experts say” and the other “High levels of vitamin D is suspected of increasing mortality rates“.
While specifically about diet and vitamin D intake, there seems to be a number of lessons from this: about communication of science (Ramesh’s original reason for posting this), widespread statistical ignorance amongst scientists (amongst others), and the fact that individuals are not averages.
Ramesh remarked:
Science reporting is broken, or science itself is broken … the masses are like deer in headlights when contradictory recommendations through titles like these appear in the mass media, one week or so apart.
I know that rickets is currently on the increase in the UK, due partly to poverty and poor diets leading to low dietary vitamin D intake, and due partly to fear of harmful UV and skin cancer leading to under-exposure of the skin to sunlight, our natural means of vitamin D production. So these issues are very important, and as Ramesh points out, clarity in reporting is crucial.
Looking at the two articles, the ‘too low’ article came from North America, the ‘too much’ article, although reported in AAAS ‘EurekaAlert!’ news, originated in University of Copenhagen, so I thought that maybe the difference is that health conscious Danes are simply overdosing.
However, even as a scientist, making sense of the reports is complicated by the fact that they talk in different units. The ‘too low’ one is about dietary intake of vitamin D measured in ‘IU/day’, and the Danish ‘too much’ report discusses blood levels in ‘nanomol per litre’. Wow that makes things easy!
Furthermore the Danish study (based on 247,574 Danes, real public health ‘big data’) showed the difference between ‘too much’ and ‘too little’, was a factor of two, 50 vs 100 nanomol/litre. It suggests, Goldilocks fashion, that 70 nanomol/liter is ‘just right’. Note however, the ‘EurekaAlert!’ news article does NOT quantify the relative risks of over and under dosing, which does make a big difference to the way they should be read as practical advice, and does not give a link to the source article to find out (this is the AAAS!).
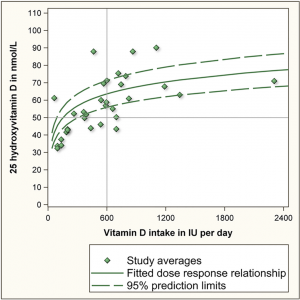
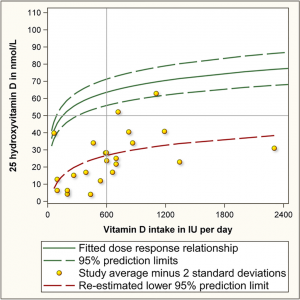
Digging a little deeper into the “too low” news report, it is based on an academic article in the journal ‘Nutrients’, “A Statistical Error in the Estimation of the Recommended Dietary Allowance for Vitamin D“, which is re-assessing the amount of dietary vitamin D to achieve the same 50 nanomol/litre level used as the ‘low’ level by the Danish researchers. The Nutrients article is based not on a new study, but a re-examination of the original meta-study that gave rise to the (US and Canadian) Institute of Medicines current recommendations. The new article points out that the original analysis confused study averages and individual levels, a pretty basic statistical mistake.
Graphs from “A Statistical Error in the Estimation of the Recommended Dietary Allowance for Vitamin D“. LHS is study averages, RHS taking not account variation within studies.
A few things I took from this:
1) The level of statistical ignorance amongst those making major decisions (in this case at the Institute of Medicine) is frightening. This is part of a wider issue of innumeracy, which I’ve seen in business/economic news reporting on the BBC, reporting of opinion polls in the Times, academic publishing and reviewing in HCI, and the list goes on. This is an issue that has worried me for some time (see “Cult of Ignorance“, “Basic Numeracy“).
2) Just how spread the data is for the studies. I guess this is because individual differences and random environmental factors are so great. This really brings home the importance of replication, which is so hard to get funded or published in many areas of academia, not least in HCI where individual differences and variations within studies are also very high. But it also emphasises the importance of making sure data is published in such a way that meta-analysis to compare and combine individual studies is possible.
3) Individual difference are large. Based on the revised suggested limits for dietary vitamin D, designed to bring at least 39/40 people over the recommended blood lower limit of 50 nanomol/litre, half of people would end up with blood levels higher than four or five times that lower limit, that is more than twice as high as the level the other study says leads to deleterious over-consumption levels. This really brings home that diet and metabolism vary such a lot between people and we need to start to understand individual variations for health advice, not simply averages. This is difficult, as illustrated by the spread of studies in the ‘too low’ article, but may become possible as more mass data, as used by the Danish study, becomes available.
In short:
individuals matter in statistics
and
statistics matter for individuals


Yet another reason why self quantification is important. With individual differences for drug (and vitamin) absorption being so large for so many products you need to understand how you metabolize the product before you know the best dose.