Busy September – talks, tutorials and an ultra-marathon

September has been a full month!

During the last two weeks things have started to kick back into action, with the normal rounds of meetings and induction week for new students.  For the latter I’d pre-recorded a video welcome, so my involvement during the week was negligible.  However, in addition I delivered a “Statistics for HCI” day course organised by the BCS Interaction Group with PhD students from across the globe and also a talk “Designing User Interactions with AI: Servant, Master or Symbiosis” at the AI Summit London.  I was also very pleased to be part of the “60 faces of IFIP” campaign by the International Federation for Information Processing.

It was the first two weeks that stood out though, as I was back on Tiree for two whole weeks.  Not 100% holiday as during the stay I gave two virtual keynotes: “Qualitative–Quantitative Reasoning: thinking informally about formal things” at the International Colloquium on Theoretical Aspects of Computing (ICTAC) in Kazakhstan and “Acting out of the Box” at the University of Wales Trinity St David (UWTSD) Postgraduate Summer School.  I also gave a couple of lectures on “Modelling interactions: digital and physical” at the ICTAC School which ran just before the conference and presented a paper on “Interface Engineering for UX Professionals” in the Workshop on HCI Engineering Education (HCI-E2) at INTERACT 2021 in Bari.  Amazing how easy it is to tour the world from a little glamping pod on a remote Scottish Island.

Of course the high point was not the talks and meetings, but the annual Tiree Ultra-marathon.  I’d missed last year, so especially wonderful to be back: thirty five miles of coastline, fourteen beaches, not to mention so many friendly faces, old friends and new.  Odd of course with Covid zero-contact and social distancing – the usual excited press of bodies at the pre-race briefing in An Talla, the Tiree community hall, replaced with a video webinar and all a little more widely spaced for the start on the beach too.

The course was slightly different too, anti-clockwise and starting half way along Gott Bay, the longest beach.  Gott Bay is usually towards the end of the race, about 28 miles in, so the long run, often into the wind is one of the challenges of the race.  I recall in 2017 running the beach with 40 mile an hour head wind and stinging rain – I knew I’d be faster walking, but was determined to run every yard of beach..  Another runner came up behind me and walked in my shelter.  However, this year had its own sting in the tail with Ben Hynish, the highest point, at 26 miles in.

The first person was across the line in about four-and-a-quarter hours, the fastest time yet.  I was about five hours later!

This was my fifth time doing the ultra, but the hardest yet, maybe in part due to lockdown couch-potato-ness!  My normal training pattern is that about a month before the ultra I think, “yikes, I’ve not run for a year” and then rapidly build up the miles – not the recommended training regime!  This year I knew I wasn’t as fit as usual, so I did start in May … but then got a knee injury, then had to self-isolate … and then it was into the second-half of July; so about a month again.

Next year it will be different, I will keep running through the winter … hmm … well, time will tell!

The different September things all sound very disparate – and they are, but there are some threads and connections.

The first thread is largely motivational.

The UWTSD keynote was about the way we are not defined by the “kind of people” we think of ourselves as being, but by the things we do.  The talk used my walk around Wales in 2013 as the central example, but the ultra would have been just as pertinent.  Someone with my waistline is not who one would naturally think as being an ultramarathon runner – not that kind of person, but I did it.

However, I was not alone.  The ‘winners’ of the ultra are typically the rangy build one would expect of a long-distance runner, but beyond the front runners, there is something about the long distance that attracts a vast range of people of all ages, and all body shapes imaginable.  For many there are physical or mental health stories: relationship breakdowns, illnesses, that led them to running and through it they have found ways to believe in themselves again.  Post Covid this was even more marked: Will, who organises the ultra, said that many people burst into tears as they crossed the finish line, something he’d never seen before.

The other thread is about the mental tools we need to be a 21st century citizen.

The ICTAC keynote was about “Qualitative–Quantitative Reasoning”, which is my term for the largely informal understanding of numbers that is so important for both day-to-day and professional life, but is not part of formal education.  The big issues of our lives from Covid to Brexit to climate change need us to make sense of large-scale numerical or data-rich phenomena.  These often seem too complex to make sense of, yet are ones where we need to make appropriate choices in both our individual lives and political voices.  It is essential that we find ways to aid understanding in the public, press and politicians – including both educational resources and support tools.

The statistics course and my “Statistics for HCI” book are about precisely this issue – offering ways to make sense of often complex results of statistical analysis and obtain some of the ‘gut’ understanding that professional statisticians develop over many years.

My 60 faces of IFIP statement also follows this broad thread:

“Digital techology is now essential to being a citizen. The future of information processing is the future of everyone; so needs to be understood and shaped by all. Often ICT simply reinforces existing patterns, but technology is only useful if we can use it to radically reimagine a better world.


More information on different events

Tiree Ultra

Tiree Ultramarathon web page and Facebook Group

Paper: Interface Engineering for UX Professionals

HCI-E2: Workshop on HCI Engineering Education – for developers, designers and more, INTERACT 2021, Bari, Italy – August 31st, 2021. See more – paper and links

Summer School Lecturea: Modelling interactions: digital and physical

Lecture at ICTAC School 2021: 18th International Colloquium on Theoretical Aspects of Computing, Nazarbayev University, Nur-Sultan, Kazakhstan, 1st September 2021. See more – abstract and links

Talk: Designing User Interactions with AI: Servant, Master or Symbiosis

The AI Summit London, 22nd Sept. 2021. See moreabstract and links

Day Course: Statistics for HCI

BCS Interaction Group One Day Course for PhD Students, 21st Sept. 2021.
See my Statistics for HCI Micro-site.

Keynote: Acting out of the Box

Rhaglen Ysgol Haf 2021 PCYDDS / UWTSD Postgraduate Summer School 2021, 10th Sept. 2021. See more – abstract and links

Keynote: Qualitative–Quantitative Reasoning: thinking informally about formal things

18th International Colloquium on Theoretical Aspects of Computing, Nazarbayev University, Nur-Sultan, Kazakhstan, 10th Sept. 2021. See more – full paper and links

Induction week greeting


Students love digital … don’t they?

In the ever accelerating rush to digital delivery, is this actually what students want or need?

Last week I was at Talis Insight conference. As with previous years, this is a mix of sessions focused on those using or thinking of using Talis products, with lots of rich experience talks. However, also about half of the time is dedicated to plenaries about the current state and future prospects for technology in higher education; so well worth attending (it is free!) whether or not you are a Talis user.

Speakers this year included Bill Rammell, now Vice-Chancellor at the University of Bedfordshire, but who was also Minister of State for Higher Education during the second Blair government, and during that time responsible for introducing the National Student Survey.

Another high profile speaker was Rosie Jones, who is Director of Library Services at the Open University … which operates somewhat differently from the standard university library!

However, among the VCs, CEOs and directors of this and that, it was the two most junior speakers who stood out for me. Eva Brittin-Snell and Alex Davie are to SAGE student scholars from Sussex. As SAGE scholars they have engaged in research on student experience amongst their peers, speak at events like this and maintain a student blog, which includes, amongst other things the story of how Eva came to buy her first textbook.

Eva and Alex’s talk was entitled “Digital through a student’s eyes” (video). Many of the talks had been about the rise of digital services and especially the eTextbook. Eva and Alex were the ‘digital natives’, so surely this was joy to their ears. Surprisingly not.

Alex, in her first year at university, started by alluding to the previous speakers, the push for book-less libraries, and general digital spiritus mundi, but offered an alternative view. Students were annoyed at being asked to buy books for a course where only a chapter or two would be relevant; they appreciated the convenience of an eBook, when core textbooks were permanently out on and, and instantly recalled once one got hold of them. However, she said they still preferred physical books, as they are far more usable (even if heavy!) than eBooks.

Eva, a fourth year student, offered a different view. “I started like Aly”, she said, and then went on to describe her change of heart. However, it was not a revelation of the pedagogical potential of digital, more that she had learnt to live through the pain. There were clear practical and logistic advantages to eBooks, there when and where you wanted, but she described a life of constant headaches from reading on-screen.

Possibly some of this is due to the current poor state of eBooks that are still mostly simply electronic versions of texts designed for paper. Also, one of their student surveys showed that very few students had eBook readers such as Kindle (evidently now definitely not cool), and used phones primarily for messaging and WhatsApp. The centre of the student’s academic life was definitely the laptop, so eBooks meant hours staring at a laptop screen.

However, it also reflects a growing body of work showing the pedagogic advantages of physical note taking, potential developmental damage of early tablet and smartphone use, and industry figures showing that across all areas eBook sales are dropping and physical book sales increasing. In addition there is evidence that children and teenagers people prefer physical books, and public library use by young people is growing.

It was also interesting that both Alex and Eva complained that eTextbooks were not ‘snappy’ enough. In the age of Tweet-stream presidents and 5-minute attention spans, ‘snappy’ was clearly the students’ term of choice to describe their expectation of digital media. Yet this did not represent a loss of their attention per se, as this was clearly not perceived as a problem with physical books.

… and I am still trying to imagine what a critical study of Aristotle’s Poetics would look like in ‘snappy’ form.

There are two lessons from this for me. First what would a ‘digital first’ textbook look like. Does it have to be ‘snappy’, or are there ways to maintain attention and depth of reading in digital texts?

The second picks up on issues in the co-authored paper I presented at NordiChi last year, “From intertextuality to transphysicality: The changing nature of the book, reader and writer“, which, amongst other things, asked how we might use digital means to augment the physical reading process, offering some of the strengths of eBooks such as the ability to share annotations, but retaining a physical reading experience.  Also maybe some of the physical limitations of availability could be relieved, for example, if university libraries work with bookshops to have student buy and return schemes alongside borrowing?

It would certainly be good if students did not have to learn to live with pain.

We have a challenge.

the educational divide – do numbers matter?

If a news article is all about numbers, why is the media shy about providing the actual data?

On the BBC News website this morning James McIvor‘s article “Clash over ‘rich v poor’ university student numbers” describes differences between Scottish Government (SNP) and Scottish Labour in the wake of Professor Peter Scott appointment as commissioner for fair access to higher education in Scotland.

Scottish Labour claim that while access to university by the most deprived has increased, the educational divide is growing, with the most deprived increasing by 0.8% since 2014, but those in the least deprived (most well off) growing at nearly three times that figure.  In contrast, the Sottish Government claims that in 2006 those from the least deprived areas were 5.8 times more likely to enter university than those in the most deprived areas, whereas now the difference is only 3.9 times, a substantial decrease in educational inequality..

The article is all about numbers, but the two parties seem to be saying contradictory things, one saying inequality is increasing, one saying it is decreasing!

Surely enough to make the average reader give up on experts, just like Michael Gove!

Of course, if you can read through the confusing array of leasts and mosts, the difference seems to be that the two parties are taking different base years: 2014 vs 2006, and that both can be true: a long term improvement with decreasing inequality, but a short term increase in inequality since 2014.  The former is good news, but the latter may be bad news, a change in direction that needs addressing, or simply ‘noise’ as we are taking about small changes on big numbers.

I looked in vain for a link to the data, web sites or reports n which this was based, after all this is an article where the numbers are the story, but there are none.

After a bit of digging, I found that the data that both are using is from the UCAS Undergraduate 2016 End of Cycle Report (the numerical data for this figure and links to CSV files are below).

Figure from UCAS 2016 End of Cycle Report

Looking at these it is clear that the university participation rate for the least deprived quintile (Q5, blue line at top) has stayed around 40% with odd ups and downs over the last ten years, whereas the participation of the most deprived quintile has been gradually increasing, again with year-by-year wiggles.  That is the ratio between least and most deprived used to be about 40:7 and now about 40:10, less inequality as the SNP say.

For some reason 2014 was a dip year for the Q5.  There is no real sign of a change in the long-term trend, but if you take 2014 to 2016, the increase in Q5 is larger than the increase in Q1, just as Scottish Labour say.  However, any other year would not give this picture.

In this case it looks like Scottish Labour either cherry picked a year that made the story they wanted, or simply accidentally chose it.

The issue for me though, is not so much who was right or wrong, but why the BBC didn’t present this data to make it possible to make this judgement?

I can understand the argument that people do not like, or understand numbers at all, but where, as in this case, the story is all about the numbers, why not at least present the raw data and ideally discuss why there is an apparent contradiction!


Numerical from figure 57 of UCAS  2016 End of Cycle Report

2006 2007 2008 2009 2010 2011 2012 2013 2014 2015 2016
Q1 7.21 7.58 7.09 7.95 8.47 8.14 8.91 9.52 10.10 9.72 10.90
Q2 13.20 12.80 13.20 14.30 15.70 14.40 14.80 15.90 16.10 17.40 18.00
Q3 21.10 20.60 20.70 21.30 23.60 21.10 22.10 22.50 22.30 24.00 24.10
Q4 29.40 29.10 30.20 30.70 31.50 29.10 29.70 29.20 28.70 30.30 31.10
Q5 42.00 39.80 41.40 42.80 41.70 40.80 41.20 40.90 39.70 41.10 42.30

UCAS provide the data in CSV form.  I converted this to the above tabular form and this is available in CSV or XLSX.

A tale of two conferences and the future of learning technology in the UK

Over the past few weeks I’ve been to two conferences focused on different aspects of technology and learning, Talis Insight Europe and ACM Learning at Scale (L@S). This led me to reflect on the potential for and barriers to ground breaking research in these areas in the UK.

The first conference, Talis Insight Europe, grew out of the original Talis User Group, but as well as company updates on existing and new products, also has an extensive line-up of keynotes by major educational visionaries and decision makers (including pretty much the complete line-up of JISC senior staff) and end-user contributed presentations.

hole-in-the-wall-Begin02The second, Learning @ Scale, grew out of the MOOC explosion, and deals with the new technology challenges and opportunities when we are dealing with vast numbers of students. It also had an impressive array of keynote speakers, including Sugata Mitra, famous for the ‘Hole in the Wall‘, which brought technology to street children in India.

Although there were some common elements (big data and dashboards got a mention in both!), the audiences were quite different. For Insight, the large majority were from HE (Higher Education) libraries, followed by learning technologists, industry representatives, and HE decision-makers. In contrast, L@S consisted largely of academics, many from computing or technical backgrounds, with some industry researchers, including, as I was attending largely with my Talis hat on, me.

insight-2016-jisc-keynoteIn a joint keynote at Insight, Paul Fieldman and Phil Richards the CEO and CIO of JISC, described the project to provide a learning analytics service [FR16,JI16] (including student app and, of course, dashboard) for UK institutions. As well as the practical benefits, they outlined a vision where the UK leads the way in educational big data for personalised learning.

Given a long track record of education and educational technology research in the UK, the world-leading distance-learning university provision of the Open University, and recent initiatives both those outlined by JISC and FutureLearn (building on the OUs vast experience), this vision seems not unreasonable.

However, on the ground at Learning @ Scale, there was a very different picture; the vast majority of papers and attendees were from the US, an this despite the conference being held in Edinburgh.

To some extent this is as one might expect. While traditional distance learning, including the OU, has class sizes that for those in face-to-face institutions feel massive; these are dwarfed by those for MOOCs, which started in the US; and it is in the US where the main MOOC players (Coursera, udacity, edX) are based. edX alone had initial funding more than ten times that available to FutureLearn, so in sheer investment terms, the balance at L@S is representative.

FutureLearn-logoHowever, Mike Sharples, long-term educational technology researcher and Academic Lead at FutureLearn, was one of the L@S keynotes [Sh16]. In his presentation it was clear that FutureLearn and UK MOOCs punch well above their weight, with retention statistics several times higher than US counterparts. While this may partly be due to topic areas, it is also a reflection of the development strategy. Mike outlined how empirically founded educational theory has driven the design of the FutureLearn platform, not least the importance of social learning. Perhaps then not surprisingly, one of the areas where FutureLearn substantially led over US counterparts was in social aspects of learning.

So there are positive signs for UK research in these areas. While JISC has had its own austerity-driven funding problems, its role as trusted intermediary and active platform creator offers a voice and forum that few, if any, other countries posses. Similarly, while FutureLearn needs to be sustainable, so has to have a certain inward focus, it does seem to offer a wonderful potential resource for collaborative research. Furthermore the open education resource (OER) community seems strong in the UK.

The Teaching Excellence Framework (TEF) [HC16,TH15] will bring its own problems, more about justifying student fee increases than education, potentially damaging education through yet more ill-informed political interference, and re-establishing class-based educational apartheid. However, it will certainly increase universities’ interest in education technology.

Set against this are challenges.

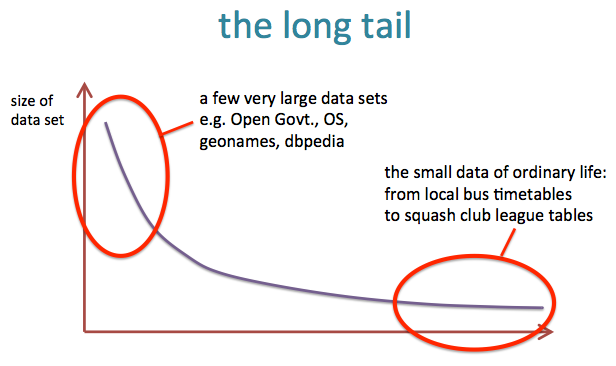
First was the topic of my own L@S work-in-progress paper – Challenge and Potential of Fine Grain, Cross-Institutional Learning Data [Dx16]. At Talis, we manage half a million reading lists, containing over 20 million resources, spread over more than 85 institutions including more than half of UK higher education. However, these institutions are all very different, and the half million courses each only may have only tens or low hundreds of students. That is very large scale in total volume, but highly heterogeneous. The JISC learning analytics repository will have exactly the same issues, and are far more difficult to deal with by machine learning or statistical analysis than the relatively homogeneous data from a single huge MOOC.

scale-up-and-down

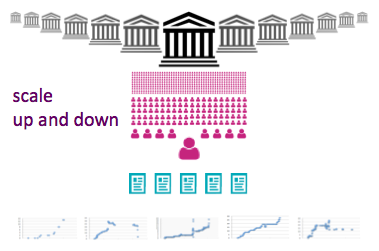
These issues of heterogeneous scale are not unique to education and ones that as a general information systems phenomena, I have been interested in for many years, and call the “long tail of small data” [Dx10,Dx15]. While this kind of data is more complex and difficult to deal with, this is of course a major research challenge, and potentially has greater long-term promise than the study of more homogeneous silos. I am finding this in my own work with musicologist [IC16,DC14], and is emerging as an issue in the natural sciences [Bo13,PC07].

long-tail

Another problem is REF, the UK ‘Research Excellence Framework’. My post-hoc analysis of the REF data revealed the enormous bias in the computing sub-panel against any form of applied and human-oriented work [Dx15b,Dx15c]. Of course, this is not a new issue, just that the available data has made this more obvious and undeniable. This affects my own core research area of human–computer interaction, but also, and probably much more substantially, learning technology research. Indeed, I think most learning technologists had already sussed this out well before REF2014 as there were very few papers submitted in this area to the computing panel. I assume most research on learning technology was submitted to the education panel.

To some extent it does not matter where research is submitted and assessed; however, while in theory the mapping between university departments and submitted units is fluid for REF, in practice submitting to ‘other’ panels is problematic making it difficult to write coherent narratives about the research environment. If learning technology research is not seen as REF-able in computing, computing departments will not recruit in these areas and discourage this kind of research. While my hope is that REF2020 will not re-iterate the mistakes of REF2014, there is no guarantee of this, and anyway the effects on institutional policy will already have been felt.

However, and happily, the kinds of research needed to make sense of this large-scale heterogeneous data may well prove more palatable to a computing REF panel than more traditional small-scale learning technology. It would be wonderful to see research collaborations between those with long-term experience and understanding of educational issues, with hard-core machine learning and statistical analysis – this is BIG DATA and challenging data. Indeed one of the few UK papers at L@S involved Pearson’s London-based data analysis department, and included automatic clustering, hidden Markov models, and regression analysis.

In short, while there are barriers in the UK, there is also great potential for exciting research that is both theoretically challenging and practically useful, bringing the insights available from large-scale educational data to help individual students and academics.

References

[Bo13] Christine L. Borgman. Big data and the long tail: Use and reuse of little data. Oxford eResearch Centre Seminar, 12th March 2013. http://works.bepress.com/borgman/269/

[Dx10] A. Dix (2010). In praise of inconsistency – the long tail of small data. Distinguished Alumnus Seminar, University of York, UK, 26th October 2011.
http://www.hcibook.com/alan/talks/York-Alumnus-2011-inconsistency/

[Dx15] A. Dix (2014/2015). The big story of small data. Talk at Open University, 11th November 2014; Oxford e-Research Centre, 10th July 2015; Mixed Reality Laboratory, Nottingham, 15th December 2015.
http://www.hcibook.com/alan/talks/OU-2014-big-story-small-data/

[DC14] Dix, A., Cowgill, R., Bashford, C., McVeigh, S. and Ridgewell, R. (2014). Authority and Judgement in the Digital Archive. In The 1st International Digital Libraries for Musicology workshop (DLfM 2014), ACM/IEEE Digital Libraries conference 2014, London 12th Sept. 2014. https://alandix.com/academic/papers/DLfM-2014/

[Dx15b] Alan Dix (2015/2016).  REF2014 Citation Analysis. accessed 8/5/2016.  https://alandix.com/ref2014/

[Dx15c] A. Dix (2015). Citations and Sub-Area Bias in the UK Research Assessment Process. In Workshop on Quantifying and Analysing Scholarly Communication on the Web (ASCW’15) at WebSci 2015 on June 30th in Oxford. http://ascw.know-center.tugraz.at/2015/05/26/dix-citations-and-sub-areas-bias-in-the-uk-research-assessment-process/

[Dx16]  Alan Dix (2016). Challenge and Potential of Fine Grain, Cross-Institutional Learning Data. Learning at Scale 2016. ACM. https://alandix.com/academic/papers/LS2016/

[FR16] Paul Feldman and Phil Richards (2016).  JISC – Helping the UK become the most advanced digital teaching and research nation in the world.  Talis Insight Europe 2016. https://talis.com/2016/04/29/jisc-keynote-paul-feldman-phil-richards-talis-insight-europe-2016/

[HC16] The Teaching Excellence Framework: Assessing Quality in Higher Education. House of Commons, Business, Innovation and Skills Committee, Third Report of Session 2015–16. HC 572.  29 February 2016.  http://www.publications.parliament.uk/pa/cm201516/cmselect/cmbis/572/572.pdf

[IC16] In Concert (2014-2016).  accessed 8/5/2016  http://inconcert.datatodata.com

[JI16]  Effective learning analytics. JISC, accessed   8/5/2016.  https://www.jisc.ac.uk/rd/projects/effective-learning-analytics

[PC07] C. L. Palmer, M. H. Cragin, P. B. Heidorn and L.C. Smith. 2007. Data curation for the long tail of science: The Case of environmental sciences. 3rd International Digital Curation Conference, Washington, DC. https://apps.lis.illinois.edu/wiki/ download/attachments/32666/Palmer_DCC2007.pdf

[Sh16]  Mike Sharples (2016).  Effective Pedagogy at Scale, Social Learning and Citizen Inquiry (keynote). Learning at Scale 2016. ACM. http://learningatscale.acm.org/las2016/keynotes/#k2

[TH15] Teaching excellence framework (TEF): everything you need to know.  Times Higher Education, August 4, 2015. https://www.timeshighereducation.com/news/teaching-excellence-framework-tef-everything-you-need-to-know


Statistics and individuals

Ramesh Ramloll recently posted on Facebook about two apparently contradictory news reports on vitamin D, one entitled “Recommendation for vitamin D intake was miscalculated, is far too low, experts say” and the other  “High levels of vitamin D is suspected of increasing mortality rates“.

While specifically about diet and vitamin D intake, there seems to be a number of lessons from this: about communication of science (Ramesh’s original reason for posting this), widespread statistical ignorance amongst scientists (amongst others), and the fact that individuals are not averages.

Ramesh remarked:

Science reporting is broken, or science itself is broken … the masses are like deer in headlights when contradictory recommendations through titles like these appear in the mass media, one week or so apart.

I know that rickets is currently on the increase in the UK, due partly to poverty and poor diets leading to low dietary vitamin D intake, and due partly to fear of harmful UV and skin cancer leading to under-exposure of the skin to sunlight, our natural means of vitamin D production.  So these issues are very important, and as Ramesh points out, clarity in reporting is crucial.

Looking at the two articles, the ‘too low’ article came from North America, the ‘too much’ article, although reported in AAAS ‘EurekaAlert!’ news, originated in University of Copenhagen, so I thought that maybe the difference is that health conscious Danes are simply overdosing.

However, even as a scientist, making sense of the reports is complicated by the fact that they talk in different units.  The ‘too low’ one is about dietary intake of vitamin D measured in ‘IU/day’, and the Danish ‘too much’ report discusses blood levels in ‘nanomol per litre’.  Wow that makes things easy!

Furthermore the Danish study (based on 247,574 Danes, real public health ‘big data’) showed the difference between ‘too much’ and ‘too little’, was a factor of two, 50 vs 100 nanomol/litre.  It suggests, Goldilocks fashion, that 70 nanomol/liter is ‘just right’.  Note however, the ‘EurekaAlert!’ news article does NOT quantify the relative risks of over and under dosing, which does make a big difference to the way they should be read as practical advice, and does not give a link to the source article to find out (this is the AAAS!).

Digging a little deeper into the “too low” news report, it is based on an academic article in the journal ‘Nutrients’,A Statistical Error in the Estimation of the Recommended Dietary Allowance for Vitamin D“, which is re-assessing the amount of dietary vitamin D to achieve the same 50 nanomol/litre level used as the ‘low’ level by the Danish researchers.  The Nutrients article is based not on a new study, but a re-examination of the original meta-study that gave rise to the (US and Canadian) Institute of Medicines current recommendations.   The new article points out that the original analysis confused study averages and individual levels, a pretty basic statistical mistake.

nutrients-06-04472-g001-1024  nutrients-06-04472-g002-1024

 Graphs from “A Statistical Error in the Estimation of the Recommended Dietary Allowance for Vitamin D“. LHS is study averages, RHS taking not account variation within studies.

A few things I took from this:

1)  The level of statistical ignorance amongst those making major decisions (in this case at the Institute of Medicine) is frightening. This is part of a wider issue of innumeracy, which I’ve seen in business/economic news reporting on the BBC, reporting of opinion polls in the Times, academic publishing and reviewing in HCI, and the list goes on.  This is an issue that has worried me for some time (see “Cult of Ignorance“, “Basic Numeracy“).

2) Just how spread the data is for the studies. I guess this is because individual differences and random environmental factors are so great.  This really brings home the importance of replication, which is so hard to get funded or published in many areas of academia, not least in HCI where individual differences and variations within studies are also very high.  But it also emphasises the importance of making sure data is published in such a way that meta-analysis to compare and combine individual studies is possible.

3) Individual difference are large.  Based on the revised suggested limits for dietary vitamin D, designed to bring at least 39/40 people over the recommended blood lower limit of 50 nanomol/litre, half of people would end up with blood levels higher than four or five times that lower limit, that is more than twice as high as the level the other study says leads to deleterious over-consumption levels.  This really brings home that diet and metabolism vary such a lot between people and we need to start to understand individual variations for health advice, not simply averages.  This is difficult, as illustrated by the spread of studies in the ‘too low’ article, but may become possible as more mass data, as used by the Danish study, becomes available.

In short:

individuals matter in statistics

and

statistics matter for individuals


Walking Wales

As some of you already know, next year I will be walking all around Wales: from May to July covering just over 1000 miles in total.

Earlier this year the Welsh Government announced the opening of the Wales Coastal Path a new long distance footpath around the whole coast of Wales. There were several existing long distance paths covering parts of the coastline, as well as numerous stretches of public footpaths at or near the coast. However, these have now been linked, mapped and waymarked creating for the first time, a continuous single route. In addition, the existing Offa’s Dyke long distance path cuts very closely along the Welsh–English border, so that it is possible to make a complete circuit of Wales on the two paths combined.

As soon as I heard the announcement, I knew it was something I had to do, and gradually, as I discussed it with more and more people, the idea has become solid.

This will not be the first complete periplus along these paths; this summer there have been at least two sponsored walkers taking on the route. However, I will be doing the walk with a technology focus, which will, I believe, be unique.

The walk has four main aspects:

personal — I am Welsh, was born and brought up in Cardiff, but have not lived in Wales for over 30 years. The walk will be a form of homecoming, reconnecting with the land and its people that I have been away from for so long. The act of encircling can symbolically ‘encompass’ a thing, as if knowing the periphery one knows the whole. Of course life is not like this, the edge is just that, not the core, not the heart. As a long term ex-pat, a foreigner in my own land, maybe all I can hope to do is scratch the surface, nibble at the edges. However, also I always feel most comfortable as an outsider, as one at the margins, so in some ways I am going to the places where I most feel at home. I will blog, audio blog, tweet and generally share this experience to the extent the tenuous mobile signal allows, but also looking forward to periods of solitude between sea and mountain.

practical — As I walk I will be looking at the IT experience of the walker and also discuss with local communities the IT needs and problems for those at the edges, at the margins. Not least will be issues due to the paucity of network access both patchy mobile signal whilst walking and low-capacity ‘broadband’ at the limits of wind-beaten copper telephone wires — none of the mega-capacity fibre optic of the cities. This will not simply be fact-finding, but actively building prototypes and solutions, both myself (in evenings and ‘days off’) and with others who are part of the project remotely or joining me for legs of the journey1. Geolocation and mobile based applications will be a core part of this, particularly for the walkers experience, but local community needs likely to be far more diverse.

philosophical — Mixed with personal reflections will be an exploration of the meanings of place, of path, of walking, of nomadicity and of locality. Aristotle’s school of philosophy was called the Peripatetic School because discussion took place while walking; over two thousand years later Wordsworth’s poetry was nearly all composed while walking; and for time immemorial routes of pilgrimage have been a focus of both spiritual service and personal enlightenment. This will build on some of my own previous writings in particular past keynotes2 on human understanding of space, and also wider literature such as Rebecca Solnit’s wonderful “Wanderlust“.  This reflection will inform the personal blogging, and after I finish I will edit this into a book or account of the journey.

research3 — the practical outcomes will intersect with various personal research interests including social empowerment, interaction design and algorithmics4.  For the walker’s experience, I will be effectively doing a form of action research!.  This will certainly include how to incorporate local maps (such as tourists town plans) effectively into more large-scale experiences, how ‘crowdsourced’ route knowledge can augment more formal digital and paper resources, data synchonisation to deal with disconnection, and data integration between diverse sources.  In addition I am offering myself as a living lab so that others can use my trip as a place to try out their own sensors and instrumentation5, information systems, content authoring, ethnographic practices, community workshops, etc.  This may involve simply asking me to use things, coming for a single meeting or day, or joining me for parts of the walk.

If any of this interests you, do get in touch.  As well as research collaborations (living lab or supporting direct IT goals) any help in managing logistics, PR, or finding sources of funding/sponsorship for basic costs, most welcome.

I’ll get a dedicated website, Facebook page, twitter account, and charity sponsorship set up soon … watch this space!

  1. Coding whilst walking is something I have thought about (but not done!) for many years, but definitely inspired more recently by Nick the amazing cycling programmer who came to the Spring Tiree Tech Wave.[back]
  2. Welsh Mathematician Walks in Cyberspace“, and “Paths and Patches: patterns of geognosy and gnosis“.[back]
  3. I tried to think of a word beginning with ‘p’ for research, but failed![back]
  4. As I tagged this post I found I was using nearly all my my most common tags — I hadn’t realised quite how much this project cuts across so many areas of interest.[back]
  5. But with the “no blood rule”: if I get sensor sores, the sensors go in the bin 😉 [back]

logo design competition – final days

The first entries are in for the logo design competition for the open HCI course I’m presenting in the autumn.  Arunn @ Talis has posted them on the wall in the office.  One is a very good cartoon style illustration, but I’m sure I don’t really look like that :-/

Final entries due by tomorrow midnight … and then Arunn is going to post them up for popular vote … and whichever gets most votes I end up wearing on a T-shirt at the HCI conference in a few weeks time.  There are times when democracy just feels wrong!

mooHCIc – a massive open online HCI course

Would you like to know more about human–computer interaction, or would you like free additional resources for your students?

Hardly a week goes by without some story about the changing face of online open education: from Khan Academy to Apple’s iTunes U and a growing number of large-scale open online courses from leading academics such as Thrun‘s AI course at Stanford.

Talis is interested in the software needed to support these new forms of large-scale open learning.  So, partly because it seems a good idea, and partly to be a willing guinea pig, I am going to run a massive online open HCI course in the autumn.

This type of course is either aimed exclusively at people outside a traditional education setting; or else, in the case of some of the university based courses, the professor/tutor is teaching their own class and then making some of the materials connected with it available on the web.

While similarly aiming to cater for those outside mainstream education, I would like also to make it easy for those in traditional university settings to use this as part of their own courses, maybe suggesting it as additional material to recommend to their students.  Even more interesting will be if the online material is incorporated more deeply into your courses, perhaps using it instead of some of the lectures/labs you would normally give.

If you are teaching a HCI course and would be interested in me being a ‘virtual guest lecturer’ by using this material (free!) please let me know.

I don’t intend to do a broad introductory HCI ‘101’ (although I may start with a short ‘laying out the area’ component), but more a series of components on particular sub-topics.  These will themselves be split into small units of perhaps 10-15 minutes ‘lecture style’ material (Khan-style voice over, or maybe mix of voice-over and head-and-shoulders).  Each sub-topic will have its own exercises, discussion areas, etc.  So, tutors intending to use this as part of their own courses can choose a sub-topic that fits into their curriculum, and likewise individuals not part of a formal course can pick appropriate topics for themselves.   I may also think of some integrative exercises for those doing more than one component.

I have yet to decide the final topics, but the following are things for which I have given some sort of tutorial or produced fresh materials recently:

  • introduction to information visualisation — using materials created for IR+InfoVis winter school in Zinal last January
  • emotion and experience — using new chapter written for next edition of HCI book, and tutorial I did at iUSEr last December
  • physicality — looking at the interactions between digital and physical product design — based on forthcoming TouchIT book
  • formal methods in HCI — as I have just written a chapter for Mads’ interaction-design.org open encyclopaedia of HCI
  • user interface software architecture — based on heavily updated chapter for next edition of HCI book
  • creativity and innovation — (wider than pure HCI audience) — drawing on experience of teaching technical creativity using ‘Bad Ideas’ and other methods, with both practical (doing it) and theoretical (understanding it) aspects
  • designing for use (adoption and appropriation) — understanding the factors that lead to products being adopted including the rich interplay between design and marketing; and then, the factors that can allow users to appropriate products to their own purposes.

I will not do all these, but if some seem particularly interesting to you or your students, let me know and I’ll make final decisions soon based on a balance between popularity and ease of production!

ignorance or misinformation – the press and higher education

I guess I shouldn’t be surprised at poor reporting in the Mail, but it does feel slightly more serious than the other tabloids.  I should explain I have a copy of the Mail as it was the only UK paper when I got on the Malaysian Airlines plane in Kuala Lumpur on Tuesday evening, and it is the Monday copy as I assume it had flown out of the UK on the flight the day before!

Deepish inside, p22, the article was “UK students lose out in sciences” by Nick Mcdermott.  The article quotes a report by Civitas that shows that while the annual number of students in so called STEM (Science, Technology, Engineering and Maths) courses rose by around 6500 in the 10 years 1997-2007, in fact this is largely due to an increase of 12,308 in overseas students and a fall in UK students of nearly 6000.  Given an overall increase in student numbers of 600,000 in this period and employers “calling for more science graduates”, the STEM drop is particularly marked.

While the figures I assume are correct, the Mail article leaves the false impression that the overseas students are in some way taking places from the UK students, indeed the article’s title “UK students lose out” suggests precisely this.  I can’t work out if this is simply the writer’s ignorance of the UK higher education system, or deliberate misinformation — neither are good news for British journalism.

Of course, the truth is precisely the opposite.  Overseas students are not in competition with UK students for undergraduate places in STEM or other subjects, as the number of UK students is effectively controlled by a combination of Government quotas and falling student demand in STEM subjects.  The latter, a disinterest in the traditionally ‘hard’ subjects by University applicants, has led to the closure of several university science departments across the country.  Rather than competing with UK students, the presence of overseas students makes courses more likely to be viable and thus preserves the variety of education available for UK students.  Furthermore, the higher fees for overseas students compared with the combined student fees and government monies for UK students, means that, if anything, these overseas students subsidise their UK colleagues.

We should certainly be asking why it is that an increasing number of overseas students value the importance of a science/engineering training while their British counterparts eschew these areas.  However, the blame for the lack of UK engineering graduates does not lie with the overseas students, but closer to home.  Somehow in our school system and popular culture we have lost a sense of the value of a deep scientific education.  Until this changes and UK students begin to apply for these subjects, we cannot expect there to be more UK graduates.  In the mean time, we can only hope that there will be more overseas students coming to study in the UK and keep the scientific and engineering expertise of universities alive until our own country finally comes to its senses.

Private schools and open data

Just read short article “Private schools aren’t doing as well right-wingers like to think” by Rob Cowen @bobbiecowman1.  Rob analyses the data on recent GCSE results and finds that independent schools have been falling behind comprehensive schools in the last couple of years.  He uses this to refute the belief that GCSE standards are dropping, although equally it calls into question David Cameron’s recent suggestion that independent schools such as Eton should be given public money to start ‘Free Schools’2.

However, this is also a wonderful example of the way open data can be used to challenge unsupported views including official ones or ‘common knowledge’.  Of course, during the recent voting reform referendum, David Cameron expressed his disinterest in data and statistics compared with gut feelings, so the availability of data is only half the battle!

Graph shwoing comprehensive vs independent school performance

  1. Thanks to Laura Cowen @lauracowen for re-tweeting this.[back]
  2. See BBC News: Cameron: ‘Eton should set up a state school’[back]