If a news article is all about numbers, why is the media shy about providing the actual data?
 On the BBC News website this morning James McIvor‘s article “Clash over ‘rich v poor’ university student numbers” describes differences between Scottish Government (SNP) and Scottish Labour in the wake of Professor Peter Scott appointment as commissioner for fair access to higher education in Scotland.
Scottish Labour claim that while access to university by the most deprived has increased, the educational divide is growing, with the most deprived increasing by 0.8% since 2014, but those in the least deprived (most well off) growing at nearly three times that figure. In contrast, the Sottish Government claims that in 2006 those from the least deprived areas were 5.8 times more likely to enter university than those in the most deprived areas, whereas now the difference is only 3.9 times, a substantial decrease in educational inequality..
The article is all about numbers, but the two parties seem to be saying contradictory things, one saying inequality is increasing, one saying it is decreasing!
Surely enough to make the average reader give up on experts, just like Michael Gove!
Of course, if you can read through the confusing array of leasts and mosts, the difference seems to be that the two parties are taking different base years: 2014 vs 2006, and that both can be true: a long term improvement with decreasing inequality, but a short term increase in inequality since 2014. The former is good news, but the latter may be bad news, a change in direction that needs addressing, or simply ‘noise’ as we are taking about small changes on big numbers.
I looked in vain for a link to the data, web sites or reports n which this was based, after all this is an article where the numbers are the story, but there are none.
After a bit of digging, I found that the data that both are using is from the UCAS Undergraduate 2016 End of Cycle Report (the numerical data for this figure and links to CSV files are below).
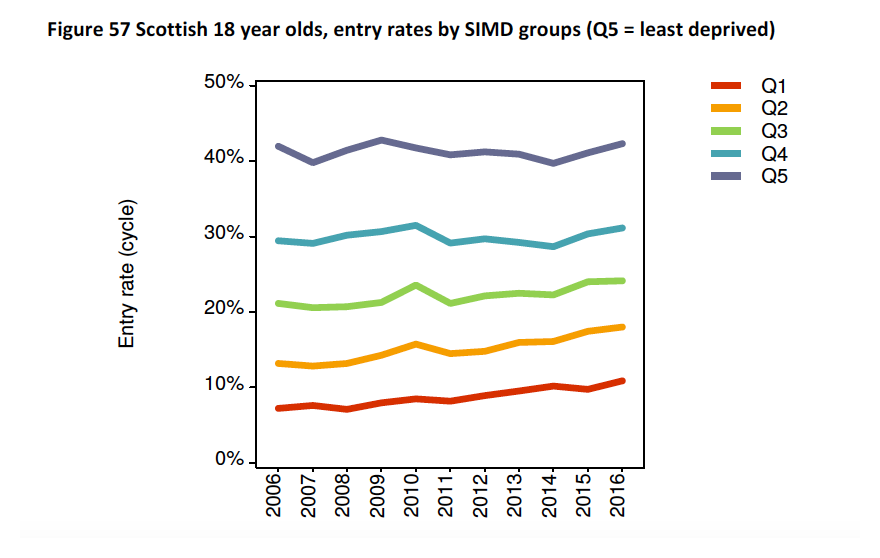
Figure from UCAS 2016 End of Cycle Report
Looking at these it is clear that the university participation rate for the least deprived quintile (Q5, blue line at top) has stayed around 40% with odd ups and downs over the last ten years, whereas the participation of the most deprived quintile has been gradually increasing, again with year-by-year wiggles. That is the ratio between least and most deprived used to be about 40:7 and now about 40:10, less inequality as the SNP say.
For some reason 2014 was a dip year for the Q5. There is no real sign of a change in the long-term trend, but if you take 2014 to 2016, the increase in Q5 is larger than the increase in Q1, just as Scottish Labour say. However, any other year would not give this picture.
In this case it looks like Scottish Labour either cherry picked a year that made the story they wanted, or simply accidentally chose it.
The issue for me though, is not so much who was right or wrong, but why the BBC didn’t present this data to make it possible to make this judgement?
I can understand the argument that people do not like, or understand numbers at all, but where, as in this case, the story is all about the numbers, why not at least present the raw data and ideally discuss why there is an apparent contradiction!
Numerical from figure 57 of UCAS 2016 End of Cycle Report
| 2006 | 2007 | 2008 | 2009 | 2010 | 2011 | 2012 | 2013 | 2014 | 2015 | 2016 | |
| Q1 | 7.21 | 7.58 | 7.09 | 7.95 | 8.47 | 8.14 | 8.91 | 9.52 | 10.10 | 9.72 | 10.90 |
| Q2 | 13.20 | 12.80 | 13.20 | 14.30 | 15.70 | 14.40 | 14.80 | 15.90 | 16.10 | 17.40 | 18.00 |
| Q3 | 21.10 | 20.60 | 20.70 | 21.30 | 23.60 | 21.10 | 22.10 | 22.50 | 22.30 | 24.00 | 24.10 |
| Q4 | 29.40 | 29.10 | 30.20 | 30.70 | 31.50 | 29.10 | 29.70 | 29.20 | 28.70 | 30.30 | 31.10 |
| Q5 | 42.00 | 39.80 | 41.40 | 42.80 | 41.70 | 40.80 | 41.20 | 40.90 | 39.70 | 41.10 | 42.30 |
UCAS provide the data in CSV form. I converted this to the above tabular form and this is available in CSV or XLSX.
You can make a broader point here, most media are unwilling to point readers to original data or documents etc. Stories about academic reports seldom include so much as a link to the original, we are often told what was said in a speech or leaked document, but not given the opportunity to read the full text.