This is the second of my posts on the citation-based analysis of REF, the UK research assessment process in computer science. The first post set the scene and explained why citations are a valid means for validating (as opposed generating) research assessment scores.
Spoiler: for outputs of similar international standing it is ten times harder to get 4* in applied areas than more theoretical areas
As explained in the previous post amongst the public domain data available is the complete list of all outputs (except a very small number of confidential reports), this does NOT include the actual REF 4*/3*/2*/1* score, but does include Scopus citation data from late 2013 and Google scholar citation data from late 2014.
From this seven variations of citation metrics were used in my comparative analysis, but essentially all give the same results.
For this post I will focus on one of them, which is perhaps the clearest, effectively turning citation data into world ranking data.
As part of the pre-submission materials, the REF team distributed a spreadsheet, prepared by Scopus, which lists for different subject areas the number of citations for the best 1%, 5%, 10% and 25% of papers in each area. These vary between areas, in particular more theoretical areas tend to have more Scopus counted citations than more applied areas. The spreadsheet allows one to normalise the citation data and for each output see whether it is in the top 1%, 5%, 10% or 25% of papers within its own area.
The overall figure across REF outputs in computing is as follows:
Top 1%      16.9%
Top 1-5%:   27.9%
Top 6-10%:  18.0%
Top 11-25%: 23.8%
Lower 75%:  13.4%
The first thing to note is that about 1 in 6 of the submitted outputs are in the top 1% worldwide and not far short of a half (45%) in the top 5%. Of course this is the top publications, so one would expect the REF submissions to score well, but still this feels like a strong indication of the quality of UK research in computer science and informatics.
According to the REF2014 Assessment criteria and level definitions, the definition of 4* is “quality that is world-leading in terms of originality, significance and rigour“, and so these world citation rankings correspond very closely to “world leading”. In computing we allocated 22% of papers as 4*, that is, roughly, if a paper is in the top 1.5% of papers world wide in its area it is ‘world leading’, which sounds reasonable.
The next level 3* “internationally excellent” covers a further 47% of outputs, so approximately top 11% of papers world wide, which again sounds a reasonable definition of “internationally excellent”. Validating the overall quality criteria of the panel.
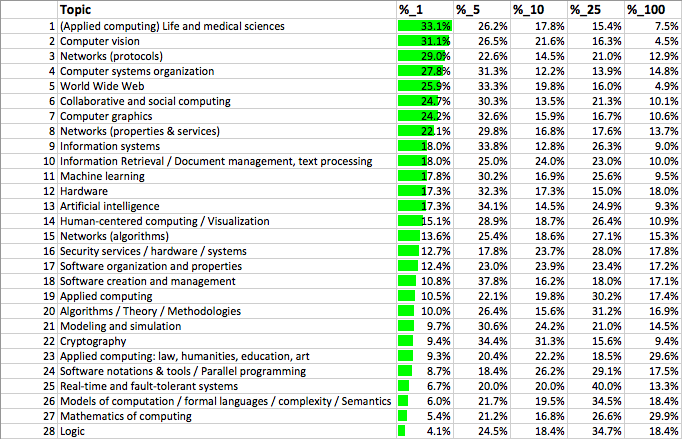
As the outputs include a sub-area tag, we can create similar world ‘league tables’ for each sub-area of computing, that is ranking the REF submitted outputs in each area amongst their own area worldwide:
As is evident there is a lot of variation, with some top areas (applications in life sciences and computer vision) with nearly a third of outputs in the top 1% worldwide, whilst other areas trail (mathematics of computing and logic), with only around 1 in 20 papers in top 1%.
Human computer interaction (my area) is split between two headings “human-centered computing” and “collaborative and social computing” between them just above mid point; AI also in the middle and Web in top half of the table.
Just as with the REF profile data, this table should be read with circumspection – it is about the health of the sub-area overall in the UK, not about a particular individual or group which may be at the stronger or weaker end.
The long-tail argument (that weaker researchers and those in less research intensive institutions are more likely to choose applied and human-centric areas) of course does not apply to logic, mathematics and formal methods at the bottom of the table. However, these areas may be affected by a dilution effect as more discursive areas are perhaps less likely to be adopted by non-first-language English academics.
This said, the definition of 4* is “Quality that is world-leading in terms of originality, significance and rigour“, and so these world rankings seem as close as possible to an objective assessment of this.
It would therefore be reasonable to assume that this table would correlate closely to the actual REF outputs, but in fact this is far from the case.
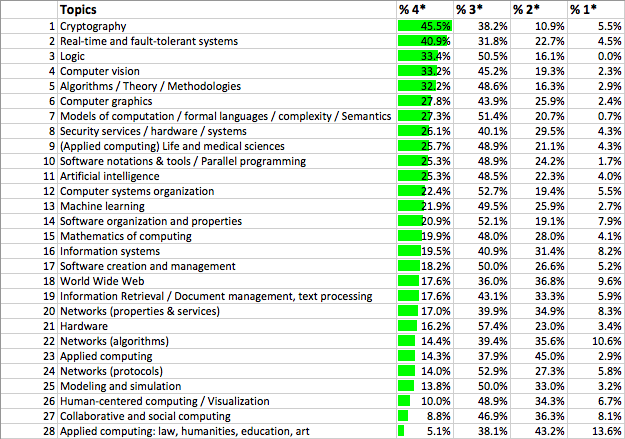
Compare this to the REF sub-area profiles in the previous post:
Some areas lie at similar points in both tables; for example, computer vision is near the top of both tables (ranks 2 and 4) and AI a bit above the middle in both (ranks 13 and 11). However, some areas that are near the middle in terms of world rankings (e.g. human-centred computing (rank 14) and even some near the top (e.g. network protocols at rank 3) come out very poorly in REF (ranks 26 and 24 respectively). On the other hand, some areas that rank very low in the world league table come very high in REF (e.g. logic rank 28 in ‘league table’ compared to rank 3 in REF).
On the whole, areas that are more applied or human focused tend to do a lot worse under REF than they appear to be when looked in terms of their world rankings, whereas more theoretical areas seem to have inflated REF rankings. Those that are traditional algorithmic computer science’ (e.g. vision, AI) are ranked similarly in REF and in the world rankings.
We will see other ways of looking at these differences in the next post, but one way to get a measure of the apparent bias is by looking at how high an output needs to be in world rankings to get a 4* depending on what area you are in.
We saw that on average, over all of computing, outputs that rank in the top 1.5% world-wide were getting 4* (world leading quality).
For some areas, for example, AI, this is precisely what we see, but for others the picture is very different.
In applied areas (e.g. web, HCI), an output needs to be in approximately the top 0.5% of papers worldwide to get a 4*, whereas in more theoretical areas (e.g. logic, formal, mathematics), a paper needs to only be in the top 5%.
That is looking at outputs equivalent in ‘world leading’-ness (which REF is trying to measure), it is 10 times easier to get a 4* in theoretical areas than applied ones.


Pingback: REF Redux 3 – plain citations | Alan Dix
Pingback: REF Redux 6 — Reasons and Remedies | Alan Dix