We have got so used to seeing R numbers quoted. However, taking this at its immediate value means we underestimate the impact of our individual and corporate actions.
Even with a lockdown R value of 0.9 when the disease is ‘under control’, a house party that leads to 10 initial infections will ultimately give rise to a further 90 cases, so is actually likely to lead to an additional Covid-19 death, probably totally unrelated to anyone at the original house party.
This multiplication factor is far bigger than the apparent 0.9 figure suggests and is at first counter-intuitive. This difference between the apparent figure and the real figure can easily lead to complacency.
If you have been following the explanations in the media you’ll know that R is the average number of further people to whom an infected person passes the disease. If R is greater than one, the disease increases exponentially – an epidemic – if R is less than one the disease gradually decays. In most countries the R-value before lockdown was between 2 and 3 (out of control), and during lockdown in the UK it reduced to a figure between 0.7 and 0.9 (slow decay).
However, note that this R value is about the average number of people directly infected by a carrier.
First it is an average – in reality most people infect fewer than the R number, but a few people infect a lot more, especially if the person has a large social network and is asymptomatic or slow to develop symptoms. This is why some news articles are picking up discussions of the ‘k’ factor1, a measure of the extent to which there is variability.
Secondly, this is about direct infections. But of course if you infect someone, they may infect another person, and so on. So if you infect 3 people, and they each infect 3 more, that is 9 second order contacts.
Thirdly, the timescale of this infection cycle is 3–4 days, about half a week. This means that an R of 3 leads to approximately 9 times as many cases two weeks later, or doubling about every 2½ days, just what we saw in the early days of Covid-19 in the UK.
Let’s look at the effect of these indirect infections for an R below 1, when the disease is under control.
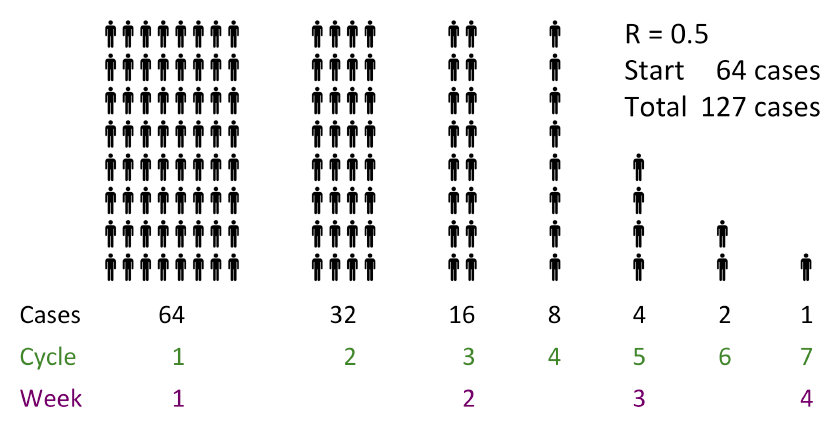
As a first example let’s take R=0.5, which is far smaller than almost anywhere has achieved even under lockdown, as an extreme example to begin with. Let’s start off with 64 cases (chosen to make the numbers add up easily!). These 64 infect 32 others, these infect 16 more, each time halving. The diagram shows this happening with two cycles of infection each week and the cases peter out after about 4 weeks. However, in that time a further 63 people have been infected.
If we do the same exercise with R = 0.9 and start off with 100 cases, we get 90 people infected from these initial 100, then a further 81 second order infections, 72 after the next cycle, and then in the following cycles (rounding down each time) 64, 57, 51, 45, 40, 36, 32, 28, 25, 22, 19, 17, 15, 13, 11, 9, 8, 7, 6, 5, 4, 3, 2, 1. That is, after 15 weeks we have a further 763 cases. On average (rather than rounding down), it is a little higher, 900 additional cases.
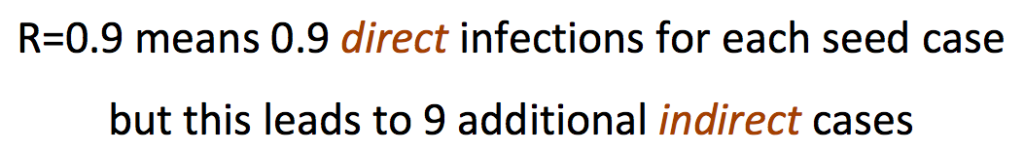
In general the number of additional cases for each seed infection is R/(1-R): 9 for R=0.9; 2.3 for R=0.7. This is very basic and well-known arithmetic series summation, but the large sizes can still be surprising even when one knows the underlying maths well.
Things get worse once R becomes greater than 1. If R is exactly 1 there is on average 1 new case for each infected person case. So if there is one ‘seed’ case, then in each succeeding week there will be two new cases for ever. In reality there will not be an infinite number of cases as eventually there will be a vaccine, further lockdown, or something to clamp down on new cases, but there is no natural limit when the new cases peter out.
Mid-range estimates in the UK suggest that during the winter we may see an R of 1.52. This is assuming that social distancing measures and effective track-and-trace are in place, but where winter weather means that people are indoors more often and transmission is harder to control. The lower bound figure being used is 1.2.
If we look over just a 5-week window, with R=1.2 each seed case leads to nearly 25 additional cases during the period; with R=1.5 this rises to over 100 new cases. Over a 10-week period (a university term), these figures are around two hundred new cases with R=1.2 or six and half thousand for R=1.5.
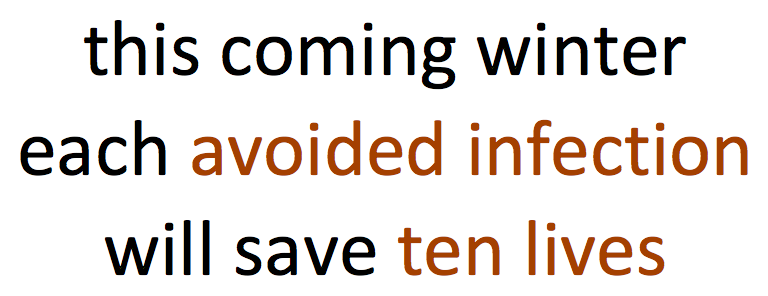
So next time you see R=0.7 think two and half, when you see R=0.9 think ten, and when you see R=1.5 think thousands.
The last of these is crucial: taking into account a mortality rate of around 1%, each avoided infection this coming winter will save around ten lives.
- For example, BBC News: Coronavirus: What is the k number and can superspreading be stopped? Rebecca Morelle, 6 June 2020[back]
- The Academy of Medical Sciences. Preparing for a challenging winter 2020-21. 14th July 2020 [back]
Pingback: Covid-19, the impact of university return | Alan Dix
Pingback: More or Less: will 50,000 people really die if the universities reopen? | Alan Dix