A Guardian article at the weekend reported on the increasing number of people being ejected from stores after being misidentified by facial recognition systems as past shoplifters [Mu26]. This commercial use of facial regulation has even less oversight than police use, which has also been causing alarm. The people at the centre of the report were eventually offered gift vouchers by the shops concerned, but only after considerable personal embarrassment and lengthy and complex processes to clear their names (or to be precise faces).
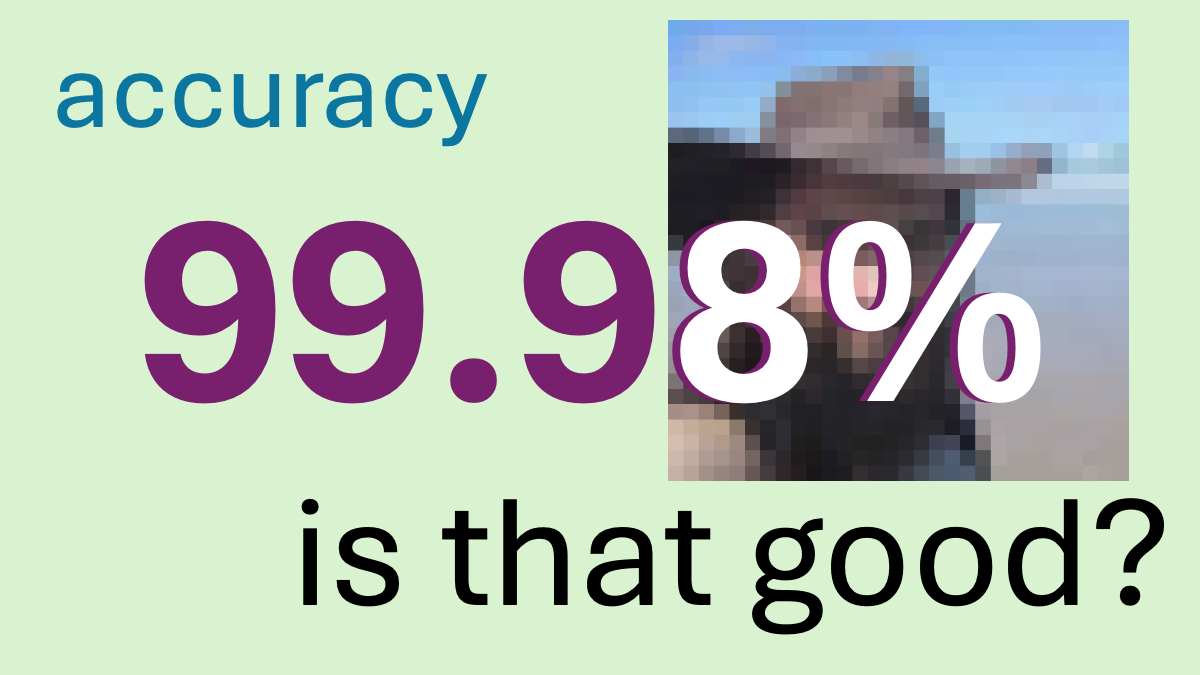
According to the article Facewatch, the company providing the facial recognition service, claim a 99.98% accuracy rate. This sounds high. Does this mean that the cases reported are rare, albeit unfortunate, incidents?
Let’s unpack this a little.
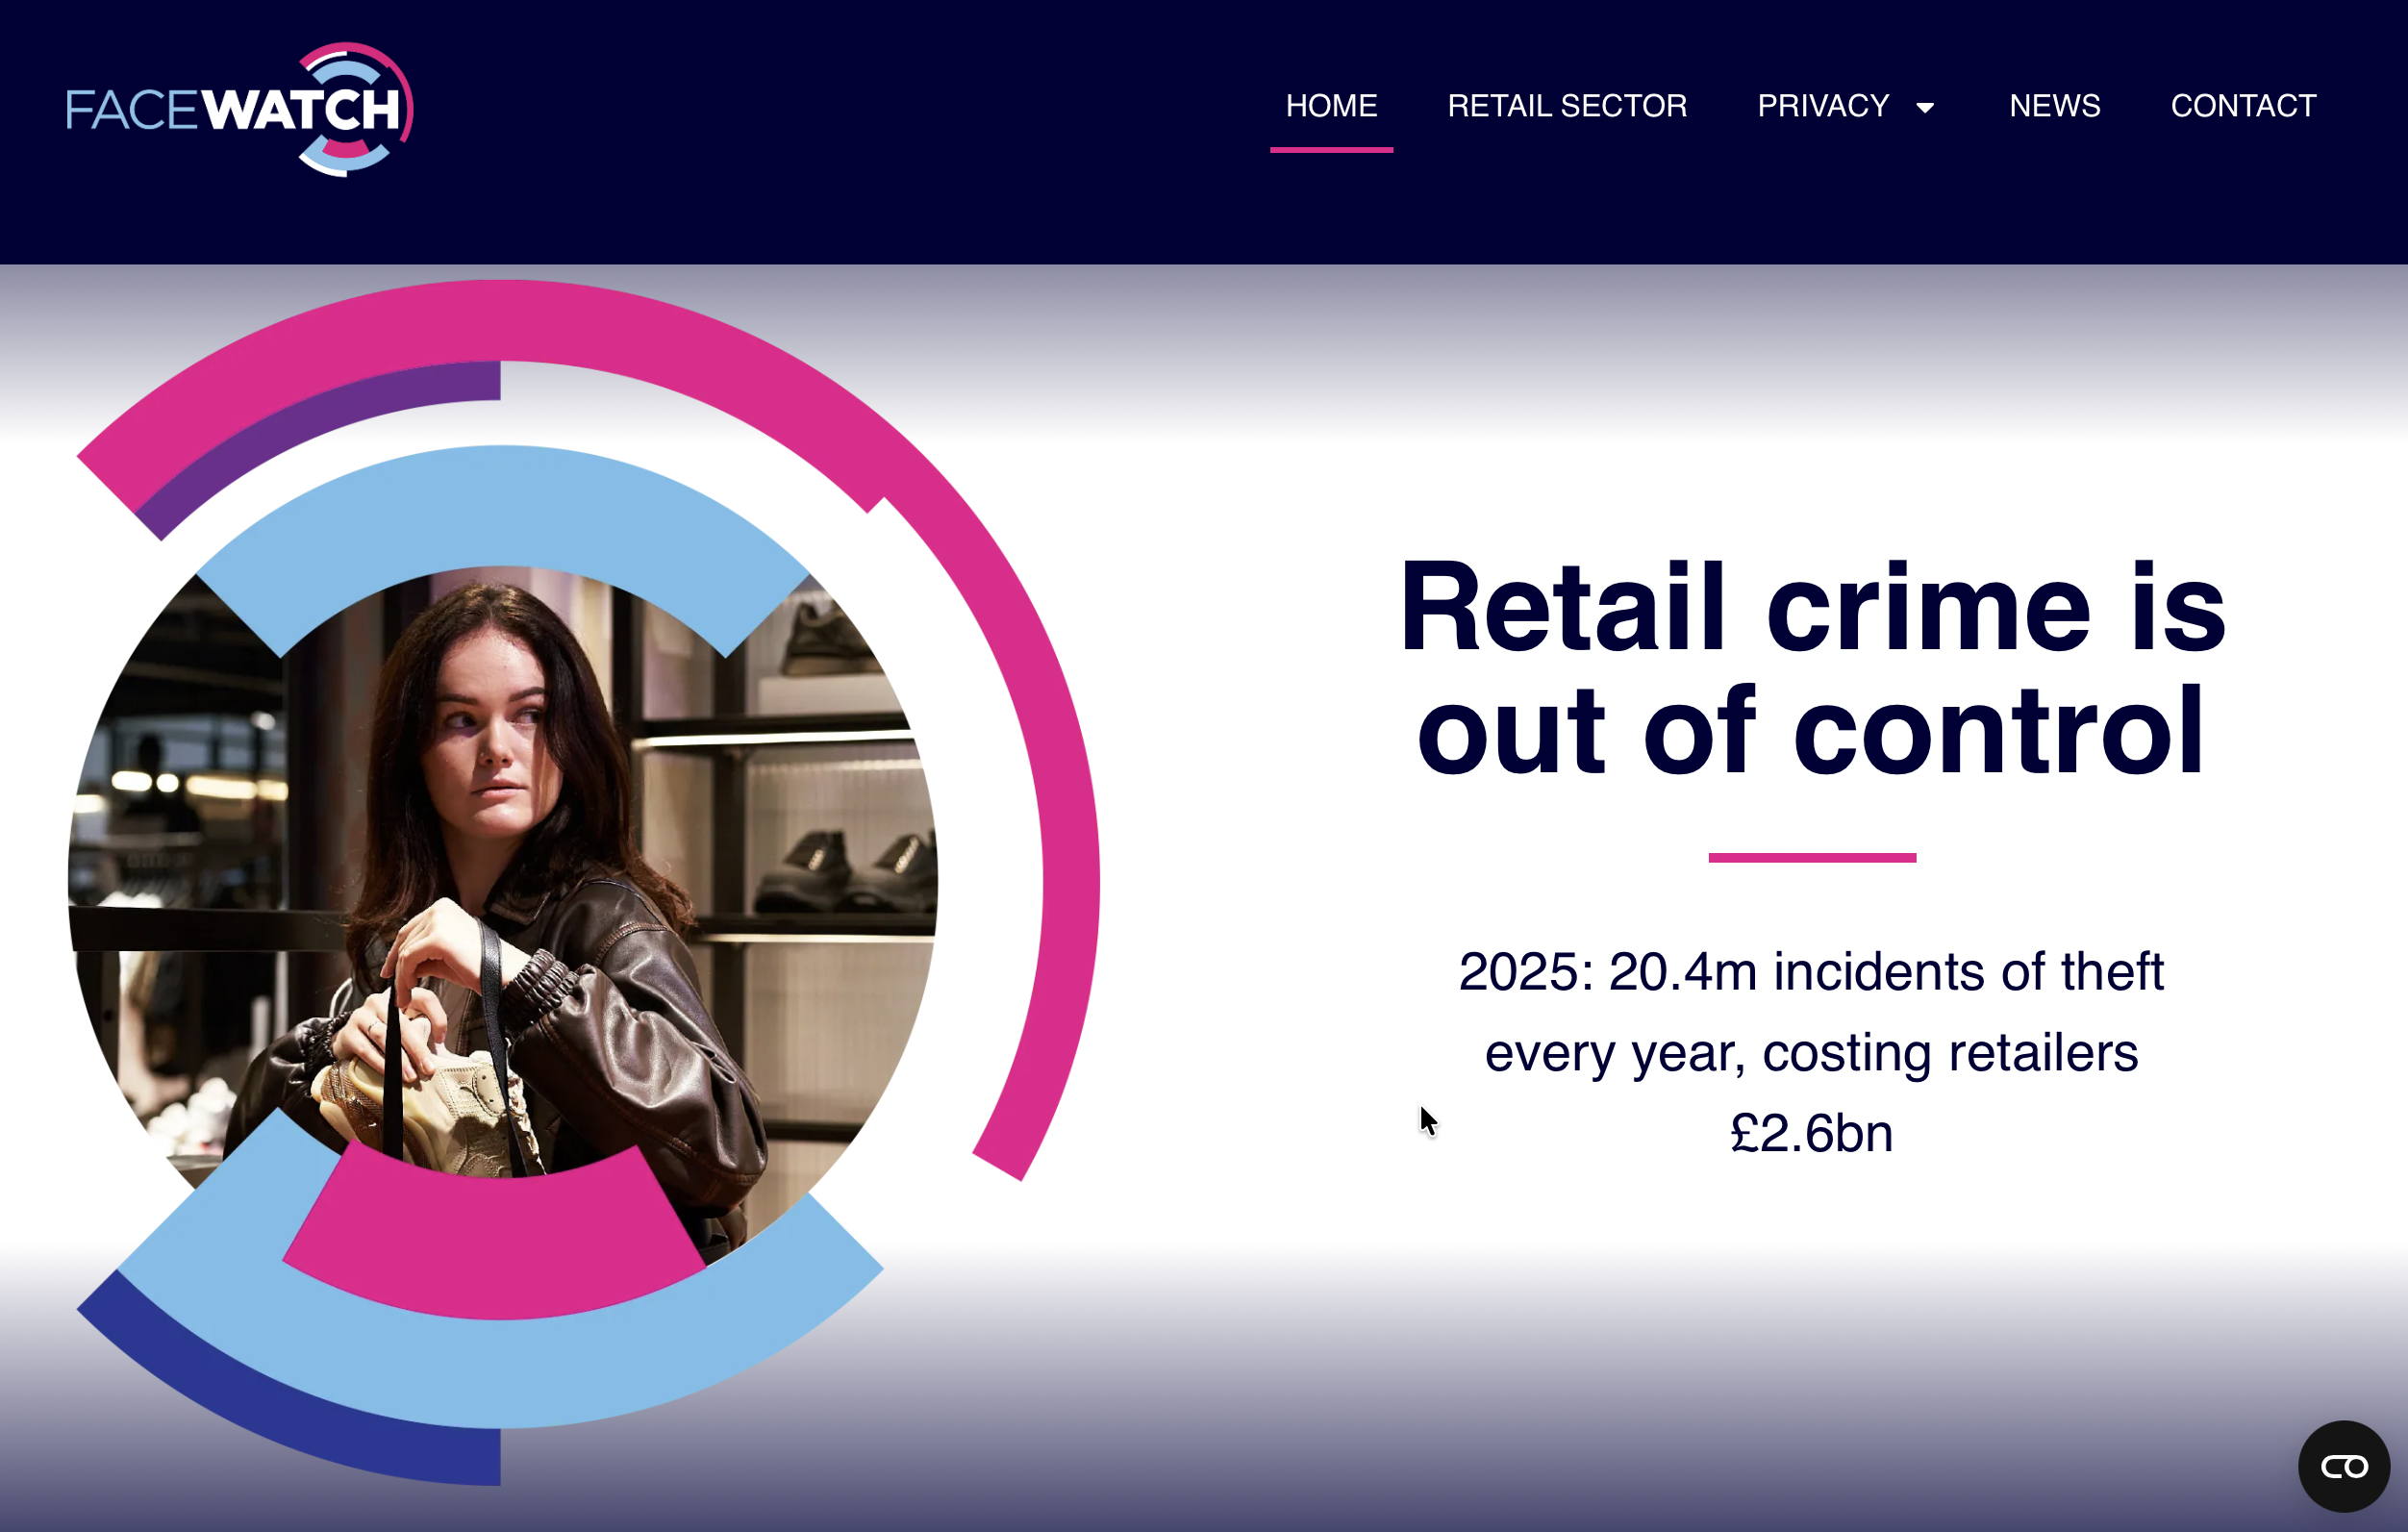
According to the UK Office of National Statistics annual report on Crime in England and Wales, there are just over half a million cases of shoplifting a year [ONS26]; the Facewatch web site offers a higher figure of 2 million across the whole UK, maybe attempting to take into account underreporting [FW26]. Let’s use this larger figure.
In the UK there are about 55 million adults, assuming on average of one shop visit per day, that is about 20 billion shopping visits per year. So that means shoplifting accounts for just one visit in 10,000.1
So, if a facial recognition systems said no-one was a past shoplifter, it would attain 99.99% accuracy!2 If on the other hand the accuracy is equal for shoplifters and non-shoplifters (that is false positive and false negative rates are the same), then there would be one misidentified innocent for every correctly identified shoplifter — hardly rare. If we use the ONS shoplifting figures, this rises to three misidentifications for each correct one.
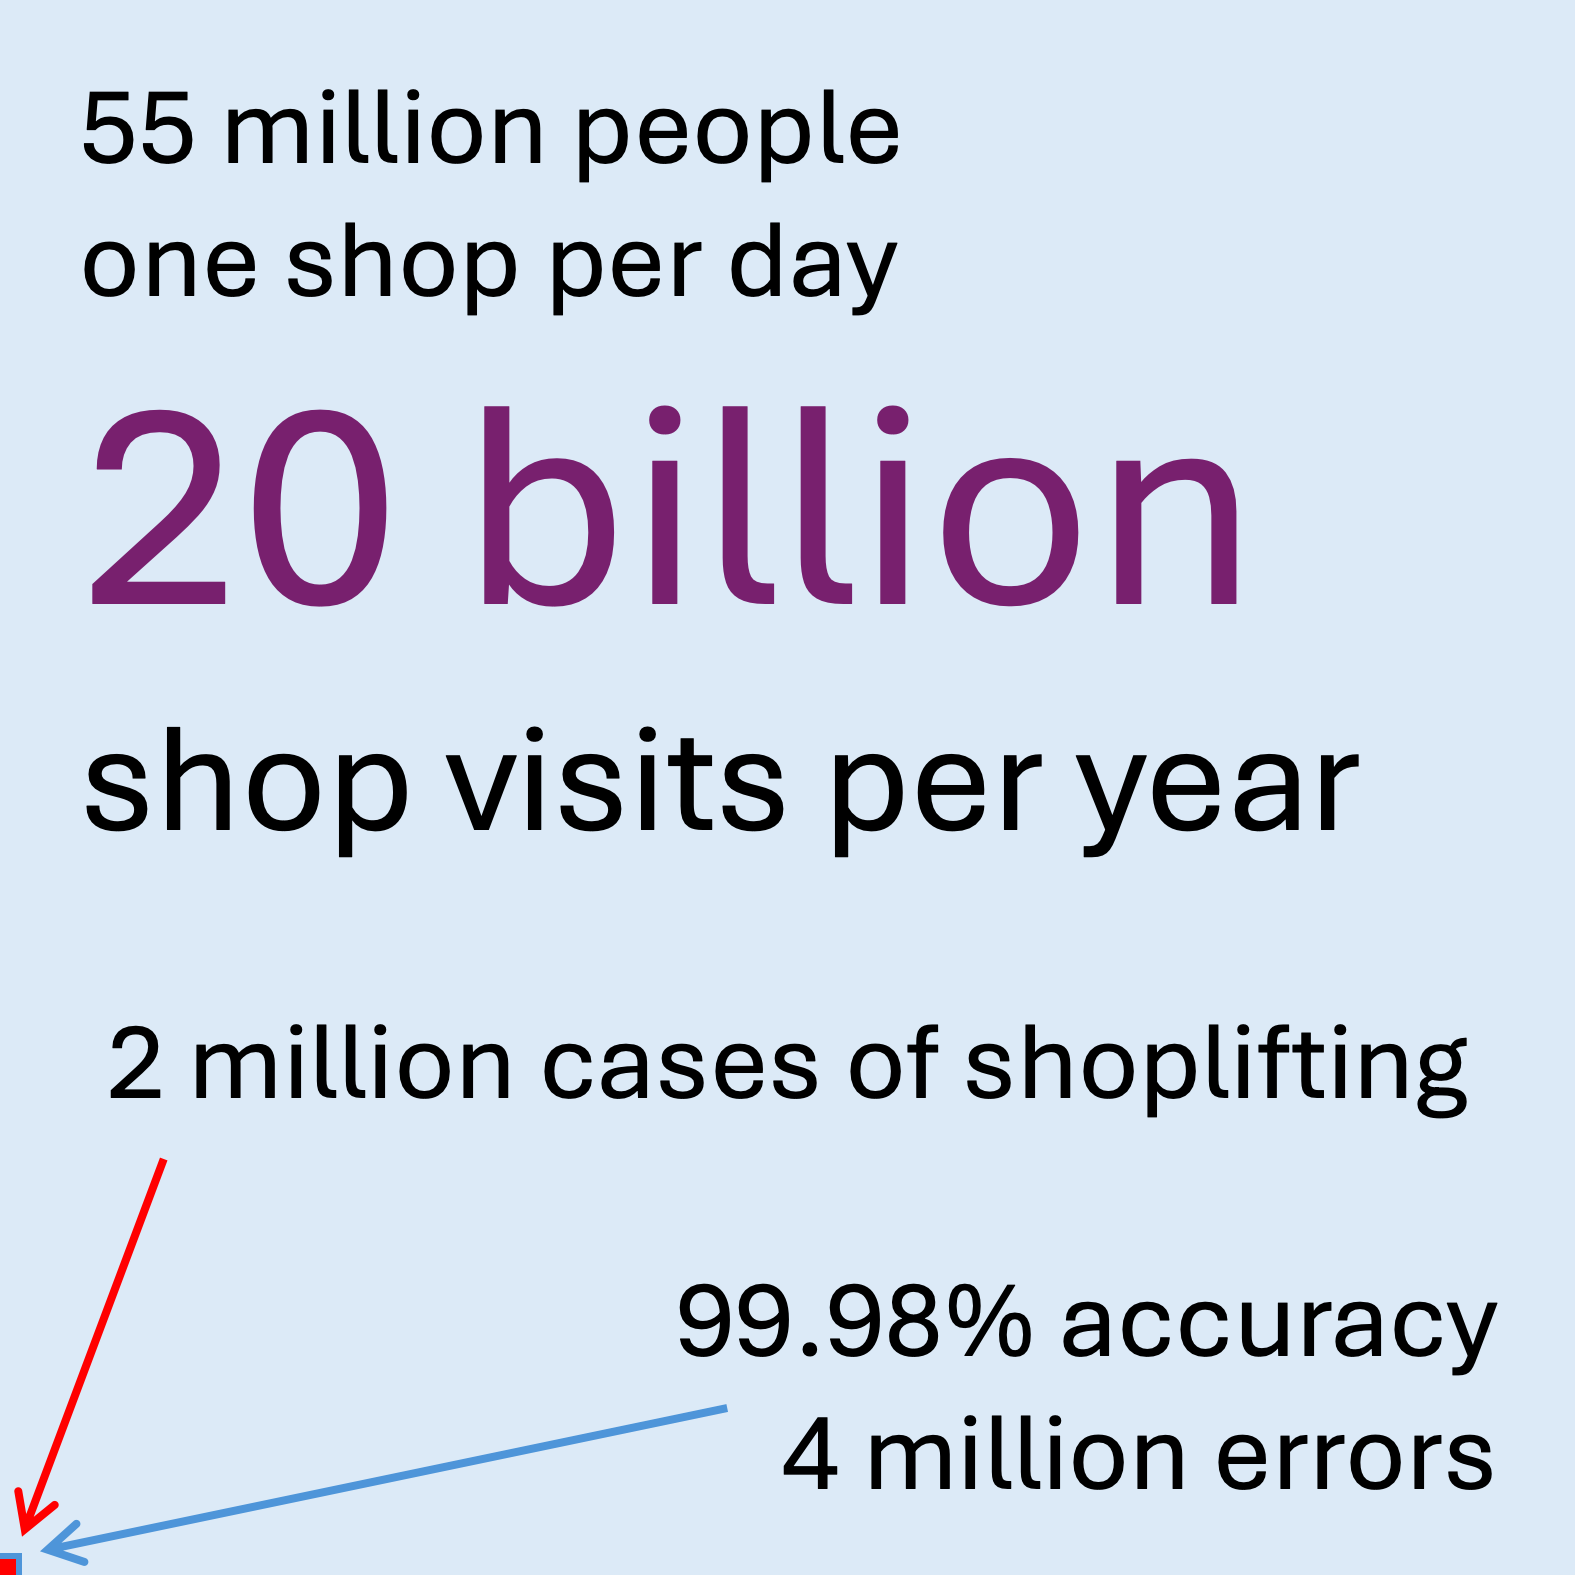
One assumes that Facewatch adjusted the system recognition thresholds to have a lower false positive rate (wrongly accused) than this, instead accepting a greater proportion of missed true shoplifters, but in this case an overall 99.98% figure is unachievable. Most likely the reported figure it is based on training data with, perhaps equal numbers of photos of shoplifters and non-shoplifters (essential to allow effective learning), so the 99.98% accuracy figure refers to this data not the numbers of each encountered in realistic (let alone real) use.
In both this case and others, such as rare disease diagnosis, seemingly high stated accuracy rates may not be as good as they at first seem, and certainly need a lot of context to be meaningful. As is clear this is by no means an abstract mathematical discussion, but one that affects real lives. In the case of the use of facial recognition, the article also reminds us that these kinds of systems often have lower accuracy rates, and in particular higher false positive rates (that is wrongly accused) for black and asian people and for women in particular.
References
[FW26] Facewath (2026). Home page. Accessed 4th May 2026. https://www.facewatch.co.uk
[Mu26] Jessica Murray. Guilty until proven innocent: shoppers falsely identified by facial recognition system struggle to clear their names. The Guardian, 3 May 2026. https://www.theguardian.com/technology/2026/may/03/guilty-until-proven-innocent-shoppers-falsely-identified-by-facial-recognition-struggle-to-clear-their-name
[ONS26] Office of National Statistics (2026). Crime in England and Wales: year ending December 2025. ONS Centre for Crime and Justice, 23 April 2026. https://www.ons.gov.uk/peoplepopulationandcommunity/crimeandjustice/bulletins/ crimeinenglandandwales/yearendingdecember2025
- It is really hard to keep track of these huge numbers. I’m expert at it, but I initially made a small slip and was out by a factor of 20.[back]
- When I read accuracy figures in academic papers on machine learning, I often do the equivalent calculation for a trivial classifier … as in this case, it is often no worse than the algorithm.[back]