Infant intimations of infinite regress

Can chance childhood thoughts shape a whole life? Maybe a lifetime studying the nuanced complexity of humanity alongside the elusive simplicity of mathematics comes down to The Woodentops.

I’m guessing I was four or five. The Woodentops was an early BBC children’s TV series, which featured a family of (wooden) puppets and their dog Spotty.  It aired alongside other favourites such as “Tales of the River Bank” and “Bill and Ben the Flowerpot Men” in the Listen with Mother slot just after lunch time (we called it dinner then), when pre-school children were at home.

One day the Woodentops’ parents went out for the day leaving the children and Spotty to look after themselves (in the days before social services would forbid this).  The childen had many adventures … all within a quarter of an hour episode.

Towards the end of the episode the parents came back and asked the children about their day.The eldest recounted the events, “we did this, and then that, and then something else, then you came back and then it was now.”

“… and then it was now” … my young brain recoiled. No it wasn’t ‘now’, because then you told them about the day … but no if you had told them that it still wouldn’t be now, because you’d then have to tell them about telling them …

At that point, faced with the infinite regress, my infant reasoning gave out.

Many years later I learnt about infinite series in mathematics, recursive functions in programming, and of course Zeno’s paradox, but each merely added to that heady mix of confusion and wonder as a child.  Years later, that Woodentops episode still speaks to me about the amazing complexity of everyday things and the need to accept the limits of understanding as well as probing those limits deeply.

I am not alone in this wonder as is evident from the general fascination with fractal patterns like the Mandelbrot set, and Russell Hoban’s  last visible dog in “The Mouse and His Child“.


Maybe this early experience also led to a lifetime’s fascination with time itself, and the elusive nature of ‘now’.

In The Woodentops episode, unlike Achilles and the tortoise in Zeno’s fable, there is no second runner except time itself, the past rushing headlong and relentless, but never catching the ever receding present.


… and if you would like to expand your cultural and philosophic horizons … here are a couple of Woodentops episodes on YouTube:

Query-by-Browsing has user explanations

Query-by-Browsing now has ‘user explanations’, ways for users to tell the machine learning component which features are significant in the user provided examples.  As promised in my blog about local AI explanations in QbB a few weeks ago, this version of QbB is released to coincide with our paper “Talking Back: human input and explanations to interactive AI systems” that Tommaso Turchi is presenting at the Workshop on Adaptive eXplainable AI (AXAI) at IUI 2025 in Cagliari, Italy,

As part of the EU Horizon Tango project, on hybrid human–AI decision making, we have been thinking about what it would mean for users to provide the AI with explanations of their human reasoning in order to guide machine learning and improve the AI’s explanations of its outputs.

As an exemplar of this I have modified QbB to include forms of user explanation.  These are of two kinds, global user explanations to guide the overall machine learning and local user explanations focused on individual examples.

Play with this version of QbB or see the QbB documentation in Alan Labs.

Basic operation

Initially you use QbB as normal: you select examples of records you do and don’t want included and the system infers a query using a variant of ID3 that can be presented as a decision tree or an SQL query.

Global user guidance

At any point you can click row headers to toggle between important (red border), ignore (grey) or standard.  The query refreshes taking into account these preferences .  Columns marked ‘ignore’ are not used at all by the machine learning, whereas those marked as ‘important’ are given preference when it creates the query.

In the screenshot below the Wage column is marked as important.  Compare this to the previous image where the name ‘Tom’ was used in the query.


Local user explanations

In addition you can click data cells in individual rows to toggle between important (red border), not important (grey) or standard.  This means that for this particular example the relevant field is more or less important.  Note that is a local explanation, just because a field is important for this record selection, it does not mean it is important for them all.

See below the same example with the column headers all equally important, but the cell with contents ‘Tom’ annotated as unimportant (grey).  The generated query does not use this value.  However, note that while the algorithm does its best to follow the preferences, it may not always be able to do so.


Under the hood

Query-by-Browsing uses a modified version of Quinlan’s ID3 decision tree induction algorithm, which has been one of the early and enduring examples of practical machine learning.  The variant used in previous versoins of QbB includes cross-column comparisons (such as ‘outgoings>income‘), but otherwise use the same information-entropy-based procedure to build the decision tree top down.

The modified version to take into account global user guidances and local user explanations still follows the top-down approach.

For the global column-based selections, the ‘ignore’ columns are not included at all and the entropy-score of the ‘important’ columns are multiplied by a weighting to make the algorithm more likely to select decisions based on these columns.  Currently this is a fixed scaling factor, but could be made variable to allow levels of importance to be added to columns.

For the local user explanations, a similar process is used except: (a) the columns for unimportant cells are scaled-down to make them less likely to be chosen rather than forbidden entirely; (b) the scaling up/down for the columns of important/unimportant cells depends on the proportion of labelled cells below the current node.  This means that the local explanation makes little difference in the higher-level nodes, where an individual cell is one amongst many unless several have similar cell-level labels, however, as one comes closer to the nodes that drive the decision for a particular annotated record its cell labelings become more significant.

Note that this is a relatively simple modification of the current algorithm.  One of the things we point out in the ‘talking back‘ paper is that user explanations open up a wide range of challenges in both user interfaces and fundamental algorithms.


AI Book glossary complete!

The glossary is complete –1229 entries in all.  All ready for the publication of the AI book in June.  The AI glossary is a resource in its own right and interlinks with the book as a hybrid digital/physical media. Read on to find more about the glossary and how it was made.

When I wrote my earlier book Statistics for HCI: Making Sense of Quantitative Data back in 2000, I created an online statistics glossary for that with 357 entries … maybe the result of too much time during lockdown?  In the paper version each term was formatted with a subtle highlight colour and in the PDF version they are all live links to the glossary.

So, when I started this second edition of Artificial Intelligence: Humans at the Heart of Algorithms I thought I should do the same, but the scale is somewhat different with more than three times as many entries.  The book is due to be published in June and you can preorder at the publisher’s site, but the glossary is live now for you to use.

What’s in the AI Glossary

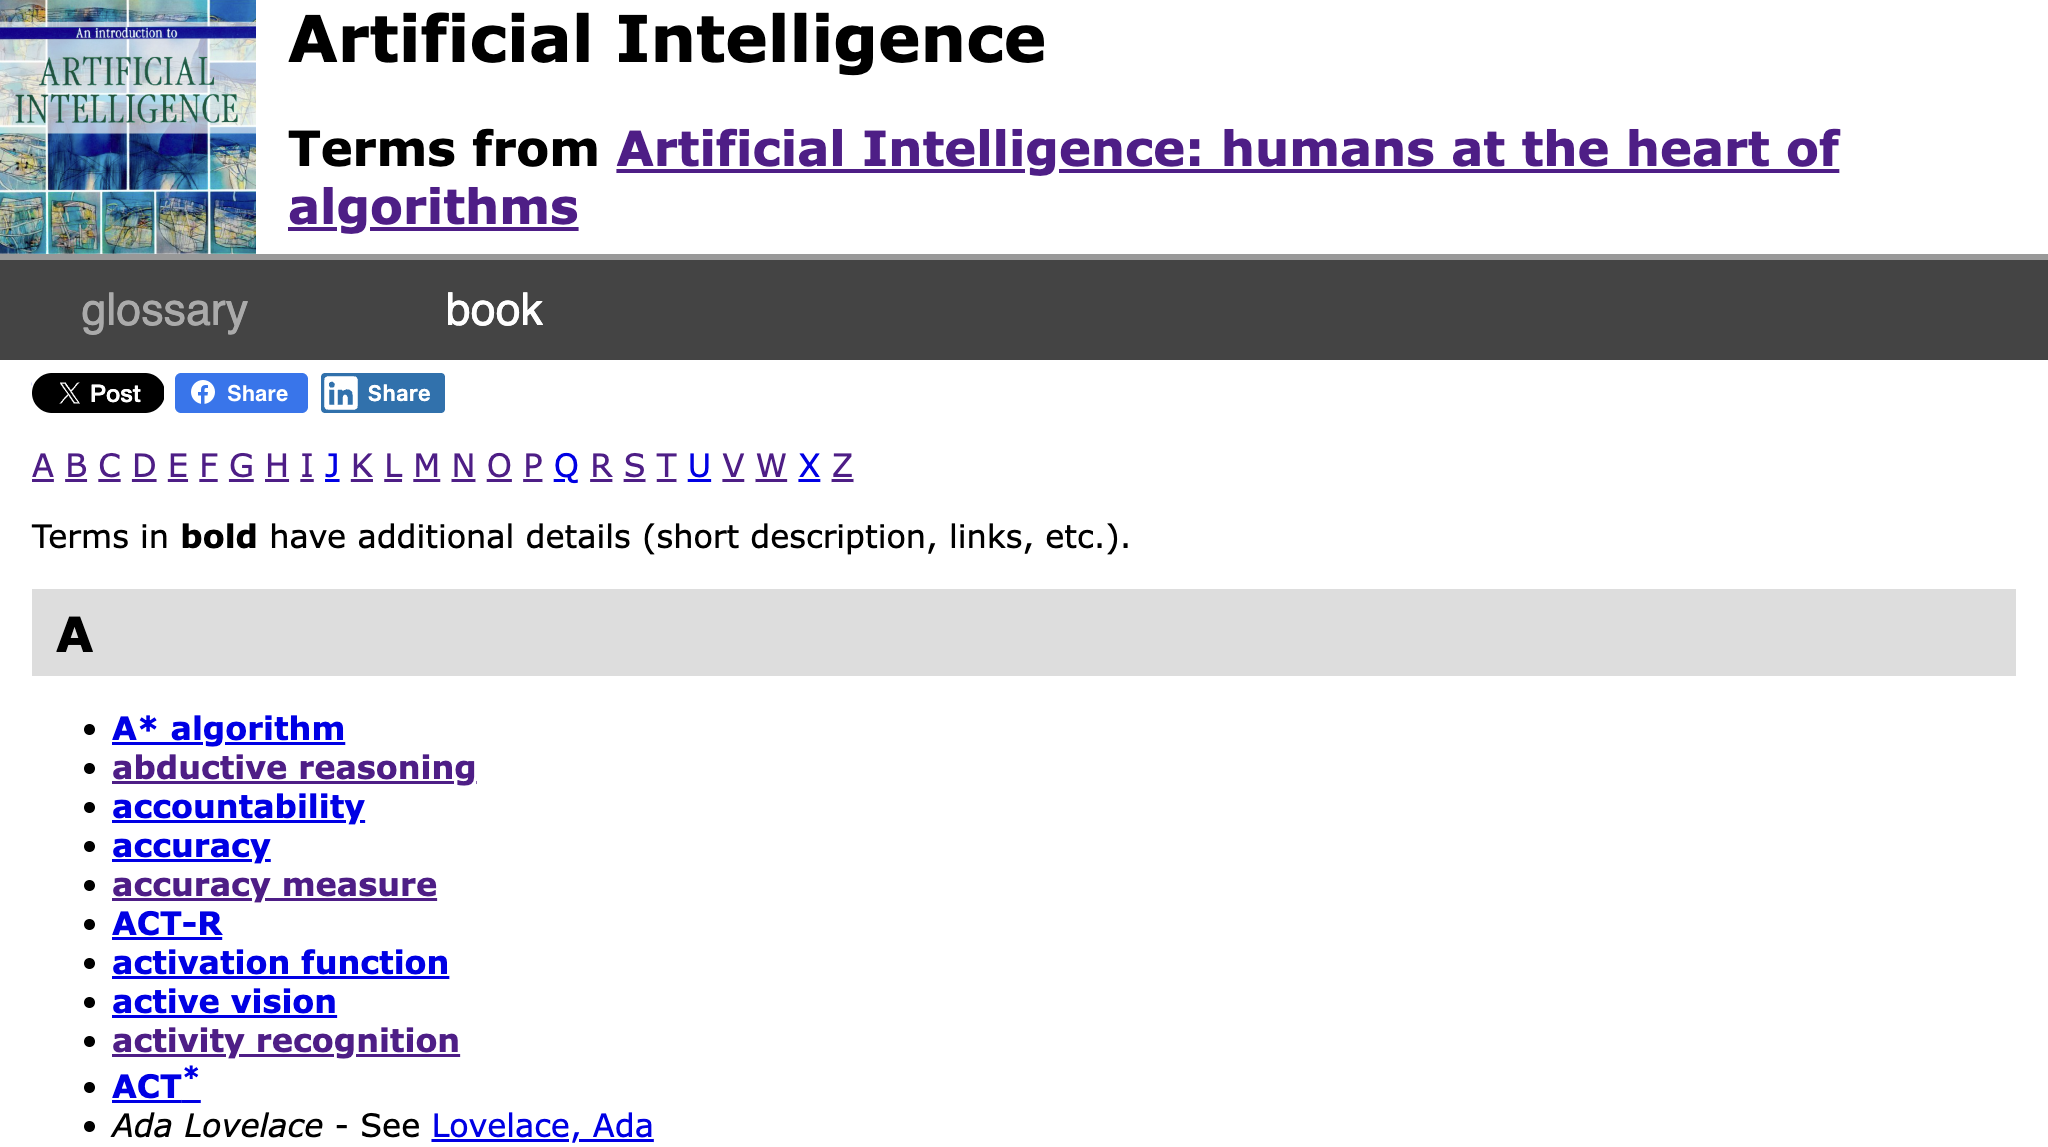
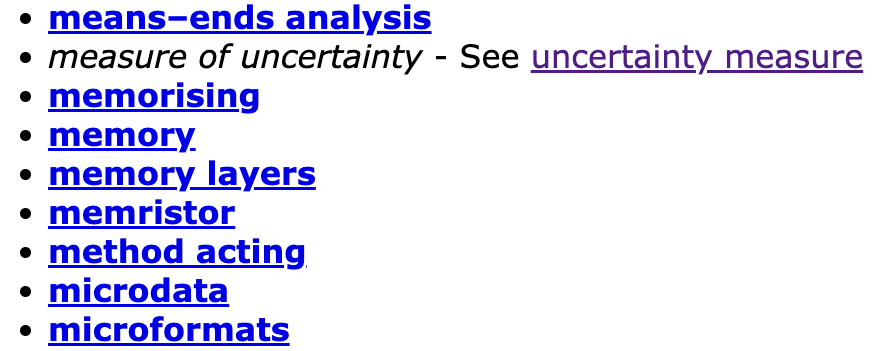
The current AI Book glossary front page is a simple alphabetical list

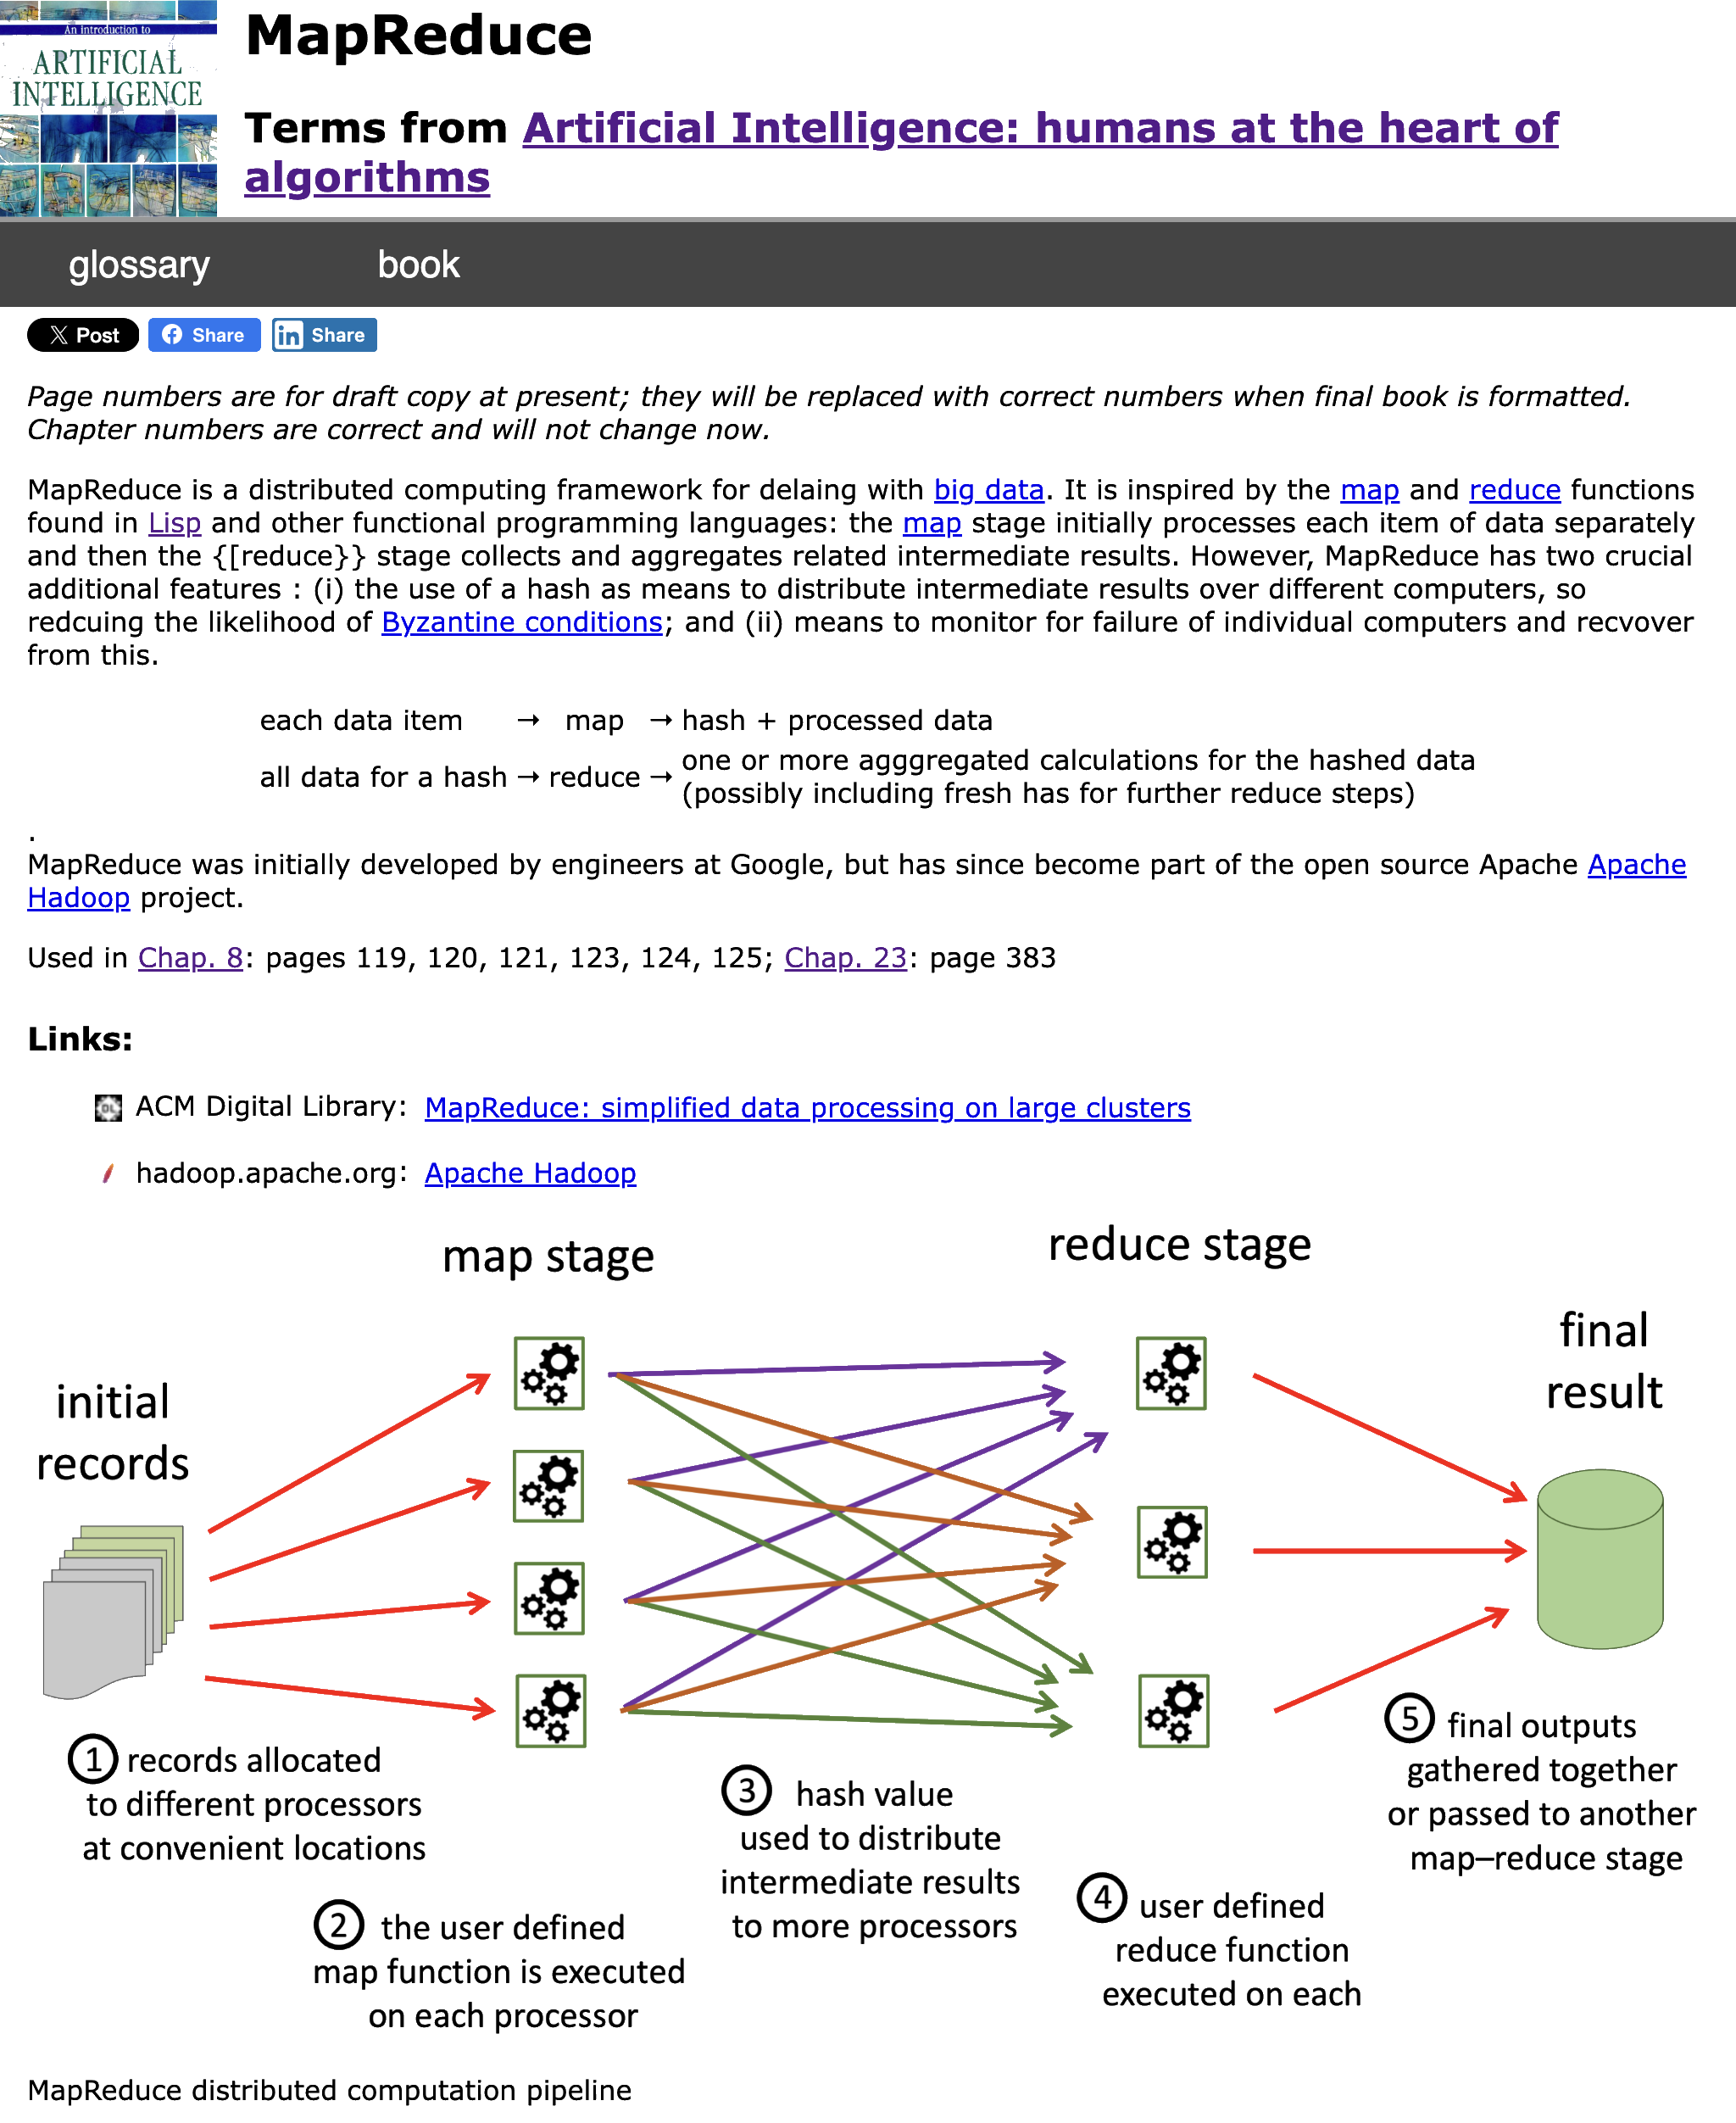
Some entries are quite short: a couple of sentences and references to the chapters and pages in the book where it is used.  However many include examples, links to external resources and images.  Some of the images are figures from the book, others created specially for the glossary.  In addition keywords in the entry link to other entries ‘wiki-style.

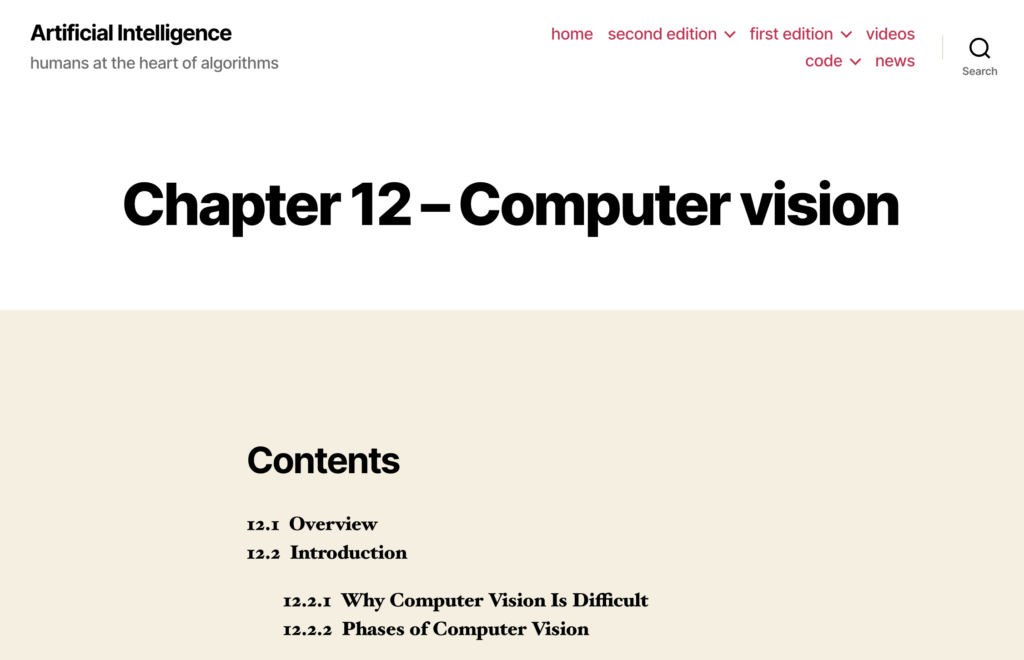
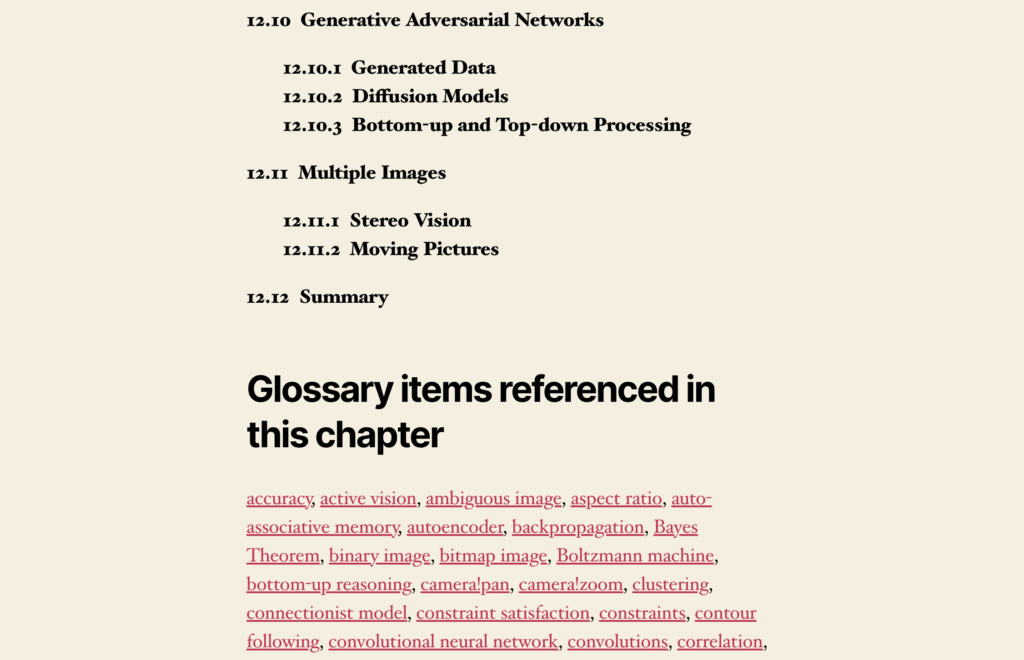
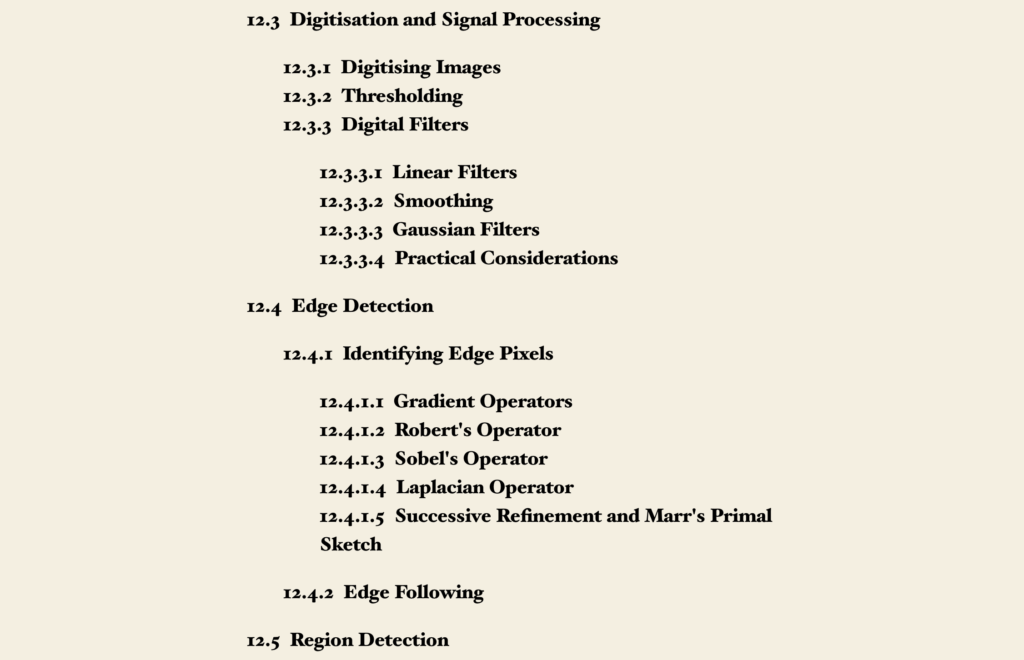
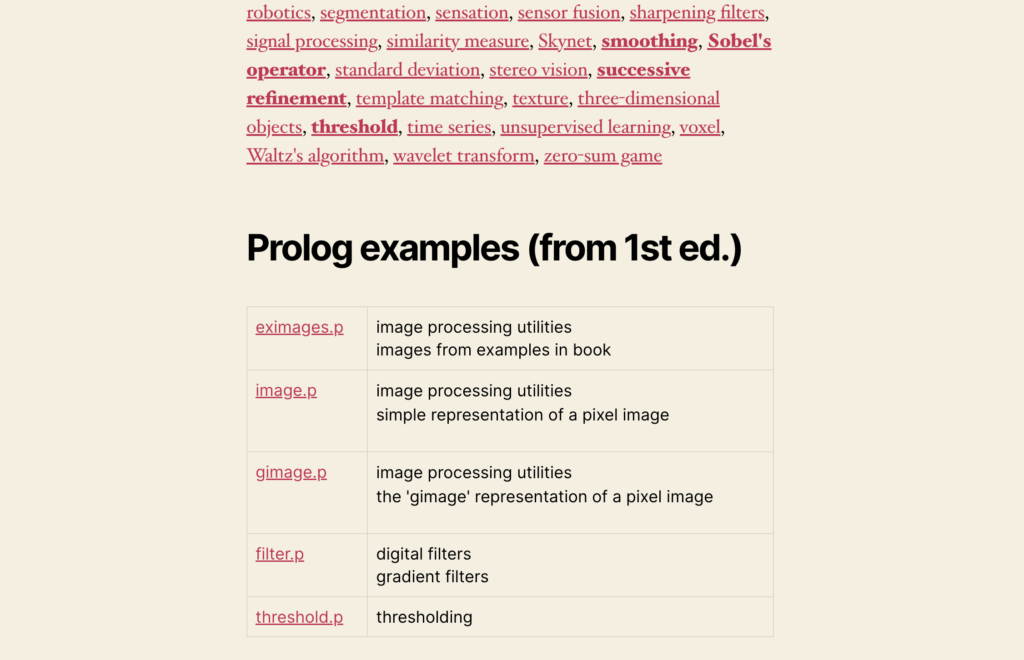
In addition the chapter pages on the AI Book web site each include references to all of the glossary items mentioned as well as a detailed table of contents and links to code examples.


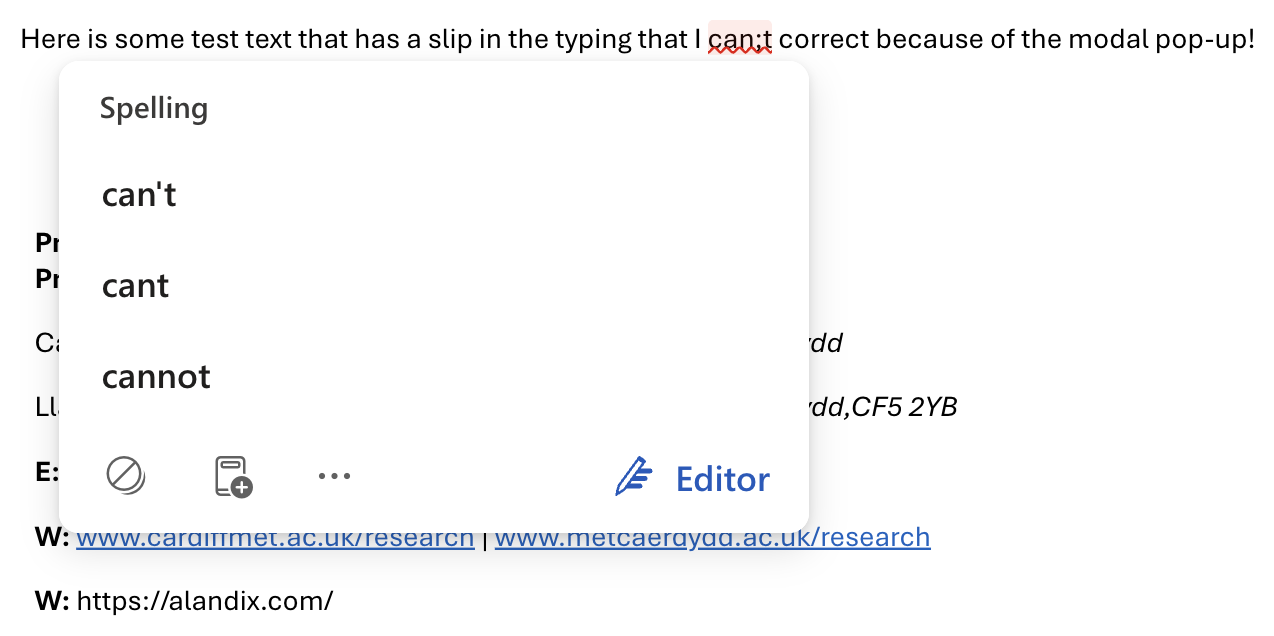
Note that while all the entries are complete, there are currently many typos and before the book is published in June I need to do another pass to fix these!  The page numbers will also update once the final production-ready proof is complete, but the chapter links are correct.

How it is made

I had already created a workflow for the HCI Stats glossary, and so was able to reuse and update that.  Both books are produced using LaTeX and in the text critical terms are marked using a number of macros, for example:

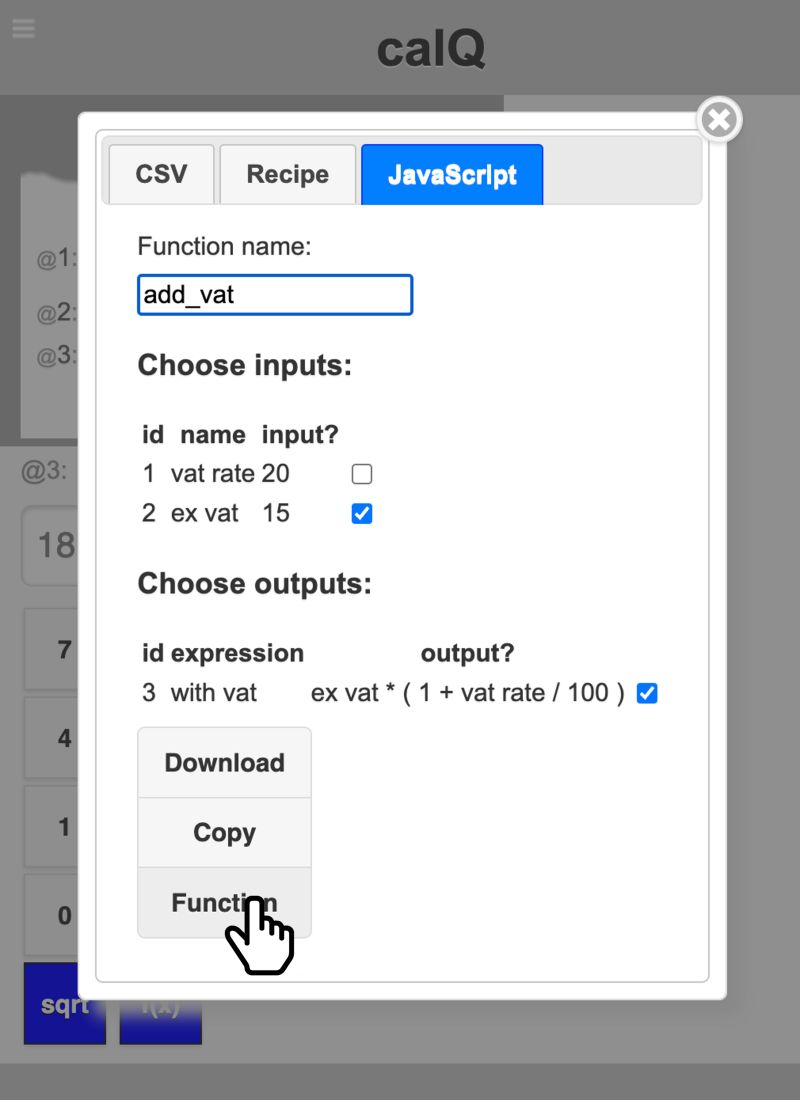
The same information is then shown (ii) with the \term{microdata} added that says that the paragraph is talking about a book, that the author is Alan Dix and that he was born in Cardiff. Finally, the extracted information is shown as \term{JSON} data in (iii).

The \term macro (and related ones such as \termdef) expand to: (a) add an entry to the index file for the term;  (b) format the text with slight highlight; and (c) add a hyperlink to the glossary.  The index items can be gathered and were used to initially populate the first column of a Google Spreadsheet:

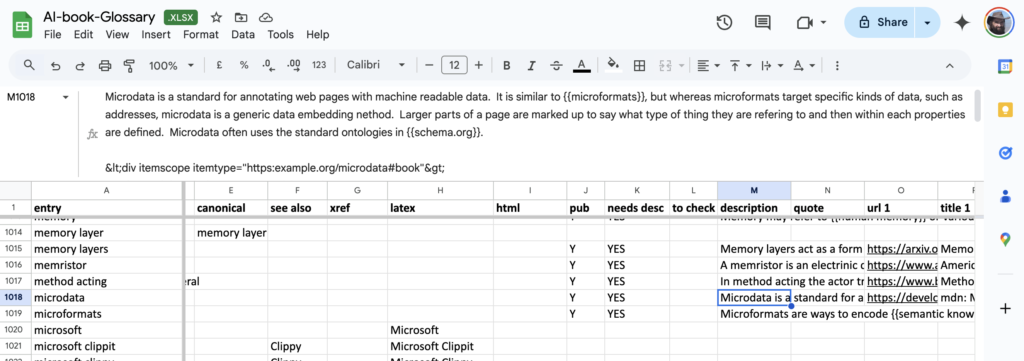
Over many months this was gradually updated.  In the final spreadsheet today (I will probably add to it over time) there are 1846 raw entries with 1229 definitions.  This includes a few items that are not explicitly mentioned in the book, but were useful for defining other entries, or new things that are emerging in the field.

On the left are two columns ‘canonical’ and ‘see also’ linking to other entries; these are used to structure the index.  Both lead to immediate redirects in the web glossary and page references in the text to the raw entry are amalgamated into the referenced entry.  However, they have slightly different behaviour in the web and book index.  If an entry has a canonical form it is usually a very close variant spelling (e.g. ise/ize endings , hyphens or plurals) and does not appear in the index at all as the referenced item will be recognisable.  The ‘see also’ links create “See …” cross references in the book and web index.

The ‘latex’ and ‘html’ show how the term should be formatted with correct capitalisation, special characters, etc.

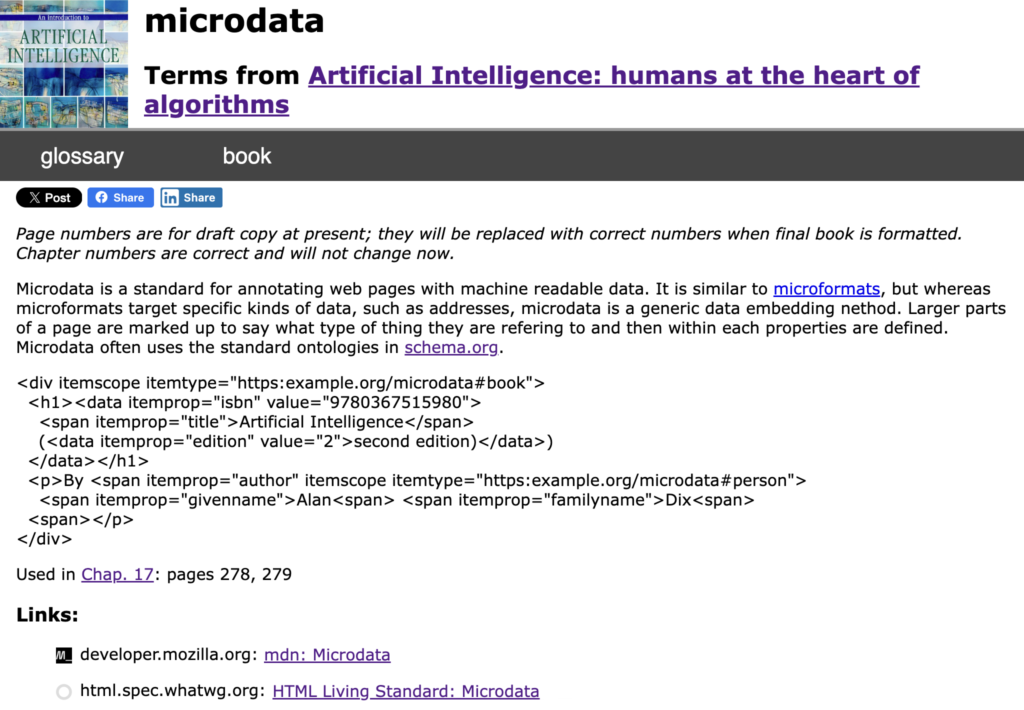
The spreadsheet entries above are formatted on the web as follows (the book version similar):

On the right of the spreadsheet are the definition and urls of links to images or related web resources.  The definitions can include cross references to other entries using a wiki-style markup, for example the reference to {{microformats}} in the definition of microdata above.  They can also include raw html.

Just before these content entries are a few columns that kept track of which entries needed attention so that I could easily scan for entries with a highlighted ‘TBD’ or ‘CHK’.

The definition of microdata selected in the above spreadsheet fragment is shown as follows:

Gamification

Working one’s way through 1846 raw entries, writing 1229 definitions comprising more than 90,000 words can be tedious!   Happily I quite accidentally gamified the experience.

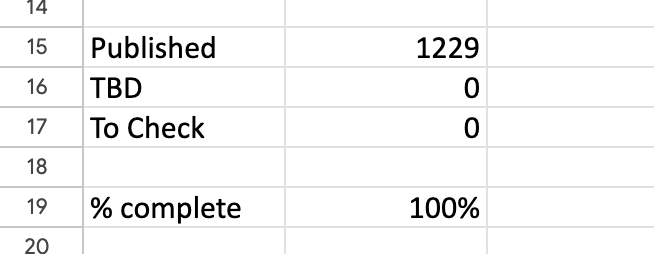
Part way through doing the HCI statistics glossary, I created a summary worksheet that kept track of the number of entries that needed to be processed and a %complete indicator.  I found it useful for that, but invaluable for the AI book glossary as it was so daunting.

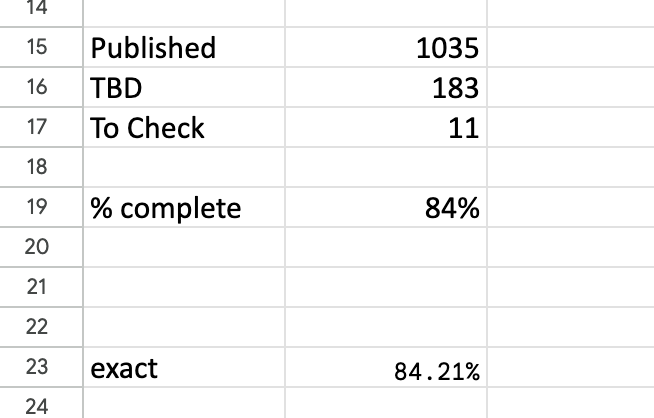
The headline summary has raw counts and a rounded %complete.  Seeing this notch up one percent was a major buzz corresponding to about a dozen entries.  Below that is a more precise percentage, which I normally kept below the bottom of the window so I had to scroll to see it.  I could take a peek and think “nearly at a the next percent mark, I’ll just do a few more”.


Query-by-Browsing gets local explanations

Query-by-Browsing (QbB) now includes local explanations so that you can explore in detail how the AI generated query relates to dataset items.

Query-by-Browsing is the system envisaged in my 1992 paper that first explored the dangers of social, ethnic and gender bias in machine-learning algorithms.  QbB generates queries, in SQL or decision tree form based on examples of records that the user does or does not want. A core feature has always been the dual intensional (query) and extensional (selected data) to aid transparency.

QbB has gone through various iterations and a simple web version has been available for twenty years, and was updated last year to allow you to use your own data (uploaded as CSV files) as well as the demo datasets.

The latest iteration also includes a form of local explanation.  If you hover over a row in the data table it shows which branch of the query meant that the row was either selected or not.

Similarly hovering over the query shows you which data rows were selected by the query branch.

However, this is not the end of the story!

In about two weeks Tommaso will be presenting our paper “Talking Back: human input and explanations to interactive AI systems” at the Workshop on Adaptive eXplainable AI (AXAI) at IUI 2025 in Cagliari, Italy,  A new version of QbB will be released to coincide with this.  This will include ‘user explanations’, allowing the user to tell the system why certain records are important to help the machine learning make better decisions.

Watch this space …


fresh version of calQ available – bluring the boundary between calculator and spreadsheet

Fresh version of calQ available, an experimental calculator that gradually blurs the boundary between calculator, spreadsheet and coding.

At first use it as a simple online 4-function calculator, but with a ’till roll’ showing you your calculation history – yes just like the old mechanical desktop ones!

If you want, when you want and when you feel comfortable, click past values and to use them in your current calculation, or to reuse constants such as tax rates. Update past values and seen later ones change, just like a mini-spreadsheet. Name lines of calculations to them to help you remember what you’ve done.

If you find yourself doing the same thing repeatedly, copy an old till roll and edit it, export the till roll into a spreadsheet or use it to make a custom function.

But if you want just add things up 🙂

Cheat Mastermind and Explainable AI

How a child’s puzzle game gives insight into more human-like explanations of AI decisions

Many of you will have played Mastermind, the simple board game with coloured pegs where you have to guess a hidden pattern.  At each turn the person with the hidden pattern scores the challenge until the challenger finds the exact colours and arrangement.

As a child I imagined a variant, “Cheat Mastermind” where the hider was allowed to change the hidden pegs mid-game so long as the new arrangement is consistent with all the scores given so far.

This variant gives the hider a more strategic role, but also changes the mathematical nature of the game.  In particular, if the hider is good at their job, it makes it a worst case for the challenger if they adopt a minimax strategy.

More recently, as part of the TANGO project on hybrid human-AI decision making, we realised that the game can be used to illustrate a key requirement for explainable AI (XAI).  Nick Chater and Simon Myers at Warwick have been looking at theories of human-to-human explanations and highlighted the importance of coherence, the need for consistency between explanations we give for a decision now and future decisions.  If I explain a food choice by saying “I prefer sausages to poultry“, you would expect me to subsequently choose sausages if given a choice.

Cheat Mastermind captures this need to make our present decisions consistent with those in the past.  Of course in the simplified world of puzzles this is a perfect match, but in real world decisions things are more complex.  Our explanations are often ‘local’ in the sense they are about a decision in a particular context, but still, if future decisions disagree wit earlier explanations, we need to be able to give a reason for the exception: “turkey dinners at Christmas are traditional“.

Machine learning systems and AI offer various forms of explanation for their decisions or classifications.  In some cases it may be a nearby example from training data, in some cases a heat map of areas of an image that were most important in making a classification, or in others an explicit rule that applies locally (in the sense of ‘nearly the same data).  The way these are framed initially is very formal, although they may be expressed in more humanly understandable visualisations.

Crucially, because these start in the computer, most can be checked or even executed (in the case of rules) by the computer.  This offers several possible strategies for ensuring future consistency or at least dealing with inconsistency … all very like human ones.

  1. highlight inconsistency with previous explanations: “I know I said X before, but this is a different kind of situation”
  2. explain inconsistency with previous explanations: “I know I said X before, but this is different because of Y”
  3. constrain consistency with previous explanations by adding the previous explanation “X” as a constraint when making future decisions. This may only be possible with some kinds of machine learning algorithms.
  4. ensure consistency by using the previous explanation “X” as the decision rule when the current situation is sufficiently close; that is completely bypass the original AI system.

The last mimics a crucial aspect of human reasoning: by being forced to reflect on our unconscious (type 1) decisions, we create explicit understanding and then may use this in more conscious rational (type 2) decision making in the future.

Of course, strategy 3 is precisely Cheat Mastermind.


Clippy returns!

Helpful suggestions aren’t helpful if they block what you are doing. You would think Microsoft would have learned that lesson with Clippy.

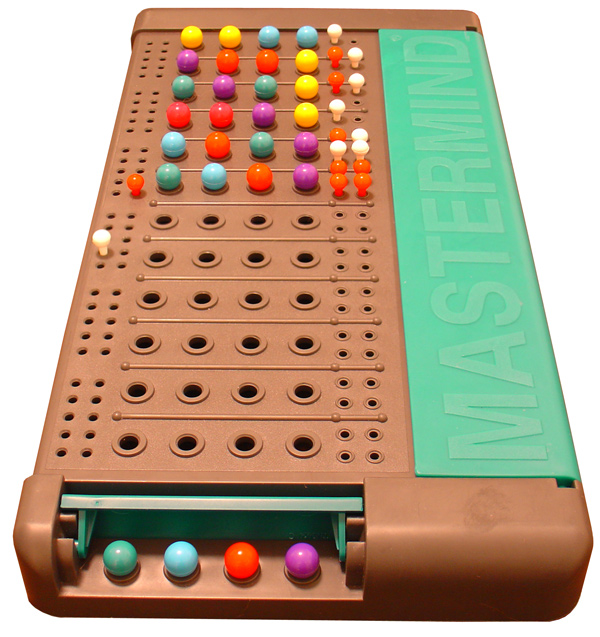
For those who don’t remember Clippy, it was an early AI agent incorporated into Office products.  If you were in Word and started to type “Dear Sam”, Clippy would pop up and say “it looks like you are writing a letter” and offered potentially helpful suggestions.  The problem was that Clippy was a modal dialog, that is, while it was showing you couldn’t type.  So of you were in the middle of typing “Dear Sam, Thank you for your letter …”, everything after the point Clippy appeared would be lost.  This violates a critical rule of appropriate intelligence, while Clippy did “good things when it was right”, it did not avoid doing “bad things when it wasn’t” 🙁

Not surprisingly, Clippy was withdrawn many years ago.

However, now in Outlook (web version) shades of Clippy return.  If you make a typo or spelling mistake, it is marked with an underline like this.

This is a trivial typo a semi-colon instead of an apostrophe in “can’t”.  So I go to correct it by clicking just after the semi-colon and then type delete followed by apostrophe.  However, the text does not change!  This is because the spelling checker has ‘helpfully’ popped up a dialog box with spelling suggestions …

… but the dialog is modal!  So, what I type is simply thrown away.  In this case it is possible to select the correct spelling, but it only after it has interrupted my flow of editing.  If no suggestion is correct one has to either click somewhere else in the message, or click  the’stop’ icon on the bottom left of the box to make the box go away (with slightly different meanings), and then continue to type what you were trying to type in the first place.

Design takeaway:  Be very cautious when using modal dialog boxes, especially when they may appear unexpectedly.

Borrowed Light

This morning here was a rainbow over the sea; not the one in the photo, the one this morning was too faint to photograph, only dusty colours at the two ends before dissolving into the clouds.

At school we learnt that rainbow were due to the way light from the sun behind is bent as it enters tiny water droplets, bounces within the droplet and then comes back out1.  The angles of entry and exit depend on refraction as the refractive indices of different colours vary slightly, there are different critical angles, hence the arcs of the rainbow.

If the water drops were not there, the sun’s light would strike the land behind the rainbow’s feet or in the upper parts simply fly past into the sky and then outer space.  It was light never destined for us but borrowed from other people and other places.  If there were no rainbows the earth would shine just a little more brightly for astronauts on the moon.

Behind the rainbow is blue sky.  Again we were taught in school how the atmosphere scatters blue light, and this gives the sky its colour. Some of the light that would otherwise fall in other places, instead is diverted to us.  Without this the sky away from the blinding sun would be black and star-spattered like night at noon.

Twilight is a magical time of things half seen and just before sunrise here is the exuberant awakening of the dawn chorus.  In these in-between times, the sun is below the horizon and yet there is still glimmering light.

Our atmosphere is fragile and thin, less than 2% of the radius of the Earth, not so much like the skin of an orange as the coating of wax on its surface, or the tissue-thin layer of dried onion skin.  The sliver of light from the sun that does not hit the earth, but skims the atmosphere is also partially scattered, lightening the sky when the sun is still hidden.  Light that would be lost to the heavens, instead finding us.

We all live in borrowed light.


  1. See Meteorological Office explanation and video.[back]

Politics of Water

Water has been at the heart of Welsh politics for many years as highlighted by an article in the BBC News today1.  However, the impacts of climate change means this is a growing issue across the world.

Man Turns on Water tap

BBC News: Wales ‘missing out on fortune’ over water powers – An ex-minister says he is “aghast” the Welsh government still hasn’t taken control of water policy.

I recall hearing on the radio about the Free Wales Army attacking water pipelines in the 1960s. I was a small child at the time and thought it all sounded very exciting, but I had no idea of the politics behind this.

It was brought home to me when I first paid water rates myself.

As a child, after my dad died, my mum was incredibly good at managing the finances and saving for bills.  Each year the household rate bill would arrive (the UK housing tax for local services).  It would be huge, but as she was on widow’s benefit there was a rebate of 90% of the bill, so the remainder was manageable.  However, this did not include water and sewage.  Once a year the water rates bill would arrive.  It was as big as the standard ‘rates’ bill, but this time there was no rebate, and at that time there was no monthly payment option.  As I said, mum was good at saving towards these big bills, but it was so big, we always knew when it hit the carpet!

Roll on the years and I am paying my own water rates bill for the first time in the early 1980s.  We lived in Bedfordshire, a county of England not known for high rainfall.  My water rates bill was £60 (about £300 today’s prices), but when I talked to my mum, in Cardiff, at the base of the Brecon Beacons with multiple reservoirs, her water bill was £300 (~£1500 today), five times higher.

The reason for this was that the water companies were semi-autonomous.  Wales is full of mountains and consequently expensive to pipe water around the country, hence the high bills.  However, Wales also has lots of water, but as this was piped across the border, there was no commensurate flow of cash back.

Happily this disparity no longer seems to be the case, I assume due to different subsidies to the water companies, but certainly highlights why the control of water is a political issue.

Separating the Waters

In the early months of 2020 the news in the UK was dominated by flooding; Covid-19 was still a distant and uncertain problem compared to the images of homes, shops, and whole communities inundated, often with filthy water contaminated by effluent forced out of drains and sewers. In insurance terms, flood is one of the natural disasters commonly referred to as “Acts of God”. Water seems to be the ultimate blessing or curse of God: the “rain falls on the just and the unjust” (Matt. 5:45) a liberal outpouring for all.

At the same time in the east of Australia bushfire raged, following an unprecedented heat wave. A little further west, in the Murray Darling Basin, a report highlighted that gigalitres of water were being wasted as large volumes of water were directed through the constricted river to almond groves near the sea, by-passing farms ravaged by drought on the way. Farmers looked on helpless as water flowed past by their parched land2.

Almond fields near Mildura. There are fears the Murray-Darling water management regime may not be able to handle the boom in the water-intensive crop. Photograph: Mike Bowers/The Guardian

Guardian 25 May 2019. Tough nut to crack: the almond boom and its drain on the Murray-Darling – Demand for the thirsty crop has created a gold rush but irrigators and growers fear there might not be enough water

As the coronavirus lockdown restricted movement across the world, it highlighted the plight of 15 million US citizens who each year have their water supply cut off for non-payment of water bills. In the UK water companies can sue and eventually bailiffs seize goods, but they cannot, by law, turn off the water supply. Water is deemed essential for human life and dignity. Not so in the US.

In normal times this is bad enough, but at least family members can use toilets and wash in their workplace or public buildings. However during lock down, confined in one’s home, there was no such recourse; bottled water could be brought in, but without a water supply faeces had to be collected and thrown out with the rubbish. One BBC report told the harrowing story of a woman with a family of eleven, who refused to let helpers drop off water at her home for shame of the smell.

How does water, the universal gift of God, become a commodity and privilege?

Water is not mentioned explicitly in the Universal Declaration of Human Rights (UDHR), but  Article 25 guarantees the right to:

“a standard of living adequate for the health and well-being of himself and of his family, including food, clothing, housing and medical care”

In addition, Article 22’s right to “social security” and the “economic, social and cultural rights indispensable for his dignity and the free development of his personality” seems highly pertinent.

Although the order of the 30 articles in the UDHR is not a priority list, it is perhaps telling that Article 25 comes well behind Article 17 which guarantees the right to private property.

Water and War

For many years there have been warnings of the impact of climate change on water supplies and the potential for conflict.  Sometimes this is largely within states as in the case of Australia and the Colorado River in the US (although the latter also impacts North Mexico).  However others cross national borders, such as the long-running disputes on the Nile, including between Egypt and Ethiopia about the construction of the Grand Ethiopian Renaissance Dam.  There have always been water wars, but the likelihood and severity are expected to rise.

It was significant that one of the first actions of the Russian invasion into Ukraine was to reopen the North Crimean Canal, which had been dammed by the Ukrainian government in 2014 cutting off the majority of the fresh water supply to the two and half million people of the Crimean peninsula.  The crisis was largely silent for many years, perhaps in part because Russia does not like to admit weakness, but back in 2020 there were warnings from open source news sites of the ever growing human, ecological and geopolitical crisis. and by 2021 this was picked by Bloomberg and the FT, the latter describing it as a ‘water war‘.  Although there are many interlinked reasons for the conflict in Ukraine, it may be we are already seeing the first major modern water war.

North Crimean Canal. Connects the Denpr at the Kakhovka reservoir with the east of Crimea.

Wikipedia: North Crimean Canal (image: Berihert, CC BY-SA 3.0)


  1. Thanks to Alan Sandry for pointing out the BBC article.[back]
  2. See 9News “Struggling Aussie farmers enraged by incredible water wastage” and full Australia Institute report “Southern discomfort: water losses in the southern Murray Darling Basin“.[back]

Another year – running and walking, changing roles and new books

Yesterday I completed the Tiree Ultramarathon, I think my sixth since they began in 2014. As always a wonderful day and a little easier than last year. This is always a high spot in the year for me, and also corresponds to the academic year change, so a good point to reflect on the year past and year ahead.  Lots of things including changing job role, books published and in preparation, conferences coming to Wales … and another short walk …

Tiree Ultra and Tech Wave

Next week there will be a Tiree Tech Wave, the first since Covid struck. Really exciting to be doing this again, with a big group coming from Edinburgh University, who are particularly interested in co-design with communities.

Aside: I nearly wrote “the first post-Covid Tiree Tech Wave”, but I am very aware that for many the impact of Covid is not past: those with long Covid, immunocompromised people who are in almost as much risk now as at the peak of the pandemic, and patients in hospital where Covid adds considerably to mortality.

Albrecht Schmidt from Ludwig-Maximilians-Universität München was here again for the Ultra. He’s been several times after first coming the year of 40 mile an hour winds and rain all day … he is built of stern stuff.  Happily, yesterday was a little more mixed, wind and driving rain in the morning and glorious sunshine from noon onwards … a typical Tiree day 😊

We have hatched a plan to have Tiree Tech Wave next year immediately after the Ultra. There are a number of people in the CHI research community interested in technology related to outdoors, exercise and well-being, so hoping to have that as a theme and perhaps attract a few of the CHI folk to the Ultra too.

Changing roles

My job roles have changed over the summer.

I’ve further reduced my hours as Director of the Computational Foundry to 50%. University reorganisation at Swansea over the last couple of years has created a School of Mathematics and Computer Science, which means that some of my activities helping to foster research collaboration between CS and Maths falls more within the School role. So, this seemed a good point to scale back and focus more on cross-University digital themes.

However, I will not be idle! I’ve also started a new PT role as Professorial Fellow at Cardiff Metropolitan University. I have been a visiting professor at the Cardiff School of Art and Design for nearly 10 years, so this is partly building on many of the existing contacts I have there. However, my new role is cross-university, seeking to encourage and grow research across all subject areas. I’ve always struggled to fit within traditional disciplinary boundaries, so very much looking forward to this.

Books and writing

This summer has also seen the publication of “TouchIT: Understanding Design in a Physical-Digital World“. Steve, Devina, Jo and I first conceived this when we were working together on the DePTH project, which ran from 2007 to 2009 as part of the AHRC/EPSRC funded Designing for the 21st Century Initiative. The first parts were written in 2008 and 2009 during my sabbatical year when I first moved to Tiree and Steve was our first visitor. But then busyness of life took over until another spurt in 2017 and then much finishing off and updating. However now it is at long last in print!

Hopefully not so long in the process, three more books are due to be published in this coming year, all around an AI theme. The first is a second edition of the “Introduction to Artificial Intelligence” textbook that Janet Finlay and I wrote way back in 1996. This has stayed in print and even been translated into Japanese. For many years the fundamentals of AI only changed slowly – the long ‘AI winter’. However, over recent years things have changed rapidly, not least driven by massive increases in computational capacity and availability of data; so it seemed like a suitable time to revisit this. Janet’s world is now all about dogs, so I’ve taken up the baton. Writing the new chapters has been easy. The editing making this flow as a single volume has been far more challenging, but after a focused writing week in August, it feels as though I’ve broken the back of it.

In addition, there are two smaller volumes in preparation as part of the Routledge and CRC AI for Everything series. One is with Clara Crivellaro on “AI for Social Justice“, the other a sole-authored “AI for Human–Computer Interaction”.

All of these were promised in 2020 early in the first Covid lockdown, when I was (rather guiltily) finding the time tremendously productive. However, when the patterns of meetings started to return to normal (albeit via Zoom), things slowed down somewhat … but now I think (hope!) all on track 😊

Welcoming you to Wales

In 2023 I’m chairing and co-chairing two conferences in Swansea. In June, ACM Engineering Interactive Computer Systems (EICS 2023) and in September the European Conference on Cognitive Ergonomics (web site to come, but here is ECCE 2022). We also plan to have a Techwave Cymru in March. So I’m looking forward to seeing lots of people in Wales.

As part of the preparation to EICS I’m planning to do a series of regular blog posts on more technical aspects of user interface development … watch this space …

Alan’s on the road again

Nearly ten years ago, in 2013, I walked around Wales, a personal journey and research expedition. I always assumed I would do ‘something else’, but time and life took over. Now, the tenth anniversary is upon me and it feels time do something to mark it.

I’ve always meant to edit the day-by-day blogs into a book, but that certainly won’t happen next year. I will do some work on the dataset of biodata, GPS, text and images that has been used in a few projects and is still a unique data set, including, I believe, still the largest single ECG trace in the public domain.

However, I will do ‘something else’.

When walking around the land and ocean boundaries of Wales, I was always aware that while in some sense this ‘encompassed’ the country, it was also the edge, the outside. To be a walker is to be a voyeur, catching glimpses, but never part of what you see.  I started then to think of a different journey, to the heart of Wales, which for me, being born and brought up in Cardiff, is the coal valleys stretching northwards and outwards. The images of coal blackened miners faces and the white crosses on the green hillside after Aberfan are etched into my own conception of Wales.

So, there will be an expedition, or rather as series of expeditions, walking up and down the valleys, meeting communities, businesses, schools and individuals.

Do you know places or people I should meet?

Do you want to join me to show me places you know or to explore new places?