Last week I attended an EPSRC workshop on “Human-Like Computing“.
The delegate pack offered a tentative definition:
“offering the prospect of computation which is akin to that of humans, where learning and making sense of information about the world around us can match our human performance.” [E16]
However, the purpose of this workshop was to clarify, and expand on this, exploring what it might mean for computers to become more like humans.
It was an interdisciplinary meeting with some participants coming from more technical disciplines such as cognitive science, artificial intelligence, machine learning and Robotics; others from psychology or studying human and animal behaviour; and some, like myself, from HCI or human factors, bridging the two.
Why?
Perhaps the first question is why one might even want more human-like computing.
There are two obvious reasons:
(i) Because it is a good model to emulate — Humans are able to solve some problems, such as visual pattern finding, which computers find hard. If we can understand human perception and cognition, then we may be able to design more effective algorithms. For example, in my own work colleagues and I have used models based on spreading activation and layers of human memory when addressing ‘web scale reasoning’ [K10,D10].
 (ii) For interacting with people — There is considerable work in HCI in making computers easier to use, but there are limitations. Often we are happy for computers to be simply ‘tools’, but at other times, such as when your computer notifies you of an update in the middle of a talk, you wish it had a little more human understanding. One example of this is recent work at Georgia Tech teaching human values to artificial agents by reading them stories! [F16]
To some extent (i) is simply the long-standing area of nature-inspired or biologically-inspired computing. However, the combination of computational power and psychological understanding mean that perhaps we are the point where new strides can be made. Certainly, the success of ‘deep learning’ and the recent computer mastery of Go suggest this. In addition, by my own calculations, for several years the internet as a whole has had more computational power than a single human brain, and we are very near the point when we could simulate a human brain in real time [D05b].
Both goals, but particularly (ii), suggest a further goal:
(iii) new interaction paradigms — We will need to develop new ways to design for interacting with human-like agents and robots, not least how to avoid the ‘uncanny valley’ and how to avoid the appearance of over-competence that has bedevilled much work in this broad area. (see more later)
Both goals also offer the potential for a fourth secondary goal:
(iv) learning about human cognition — In creating practical computational algorithms based in human qualities, we may come to better understand human behaviour, psychology and maybe even society. For example, in my own work on modelling regret (see later), it was aspects of the computational model that highlighted the important role of ‘positive regret’ (“the grass is greener on the other side”) to hep us avoid ‘local minima’, where we stick to the things we know and do not explore new options.
Human or superhuman?
Of course humans are not perfect, do we want to emulate limitations and failings?
For understanding humans (iv), the answer is probably “yes”, and maybe by understanding human fallibility we may be in a better position to predict and prevent failures.
Similarly, for interacting with people (ii), the agents should show at least some level of human limitations (even if ‘put on’); for example, a chess program that always wins would not be much fun!
However, for simply improving algorithms, goal (i), we may want to get the ‘best bits’, from human cognition and merge with the best aspects of artificial computation. Of course it maybe that the frailties are also the strengths, for example, the need to come to decisions and act in relatively short timescales (in terms of brain ‘ticks’) may be one way in which we avoid ‘over learning’, a common problem in machine learning.
In addition, the human mind has developed to work with the nature of neural material as a substrate, and the physical world, both of which have shaped the nature of human cognition.
Very simple animals learn purely by Skinner-like response training, effectively what AI would term sub-symbolic. However, this level of learning require many exposures to similar stimuli. For more rare occurrences, which do not occur frequently within a lifetime, learning must be at the, very slow pace of genetic development of instincts. In contrast, conscious reasoning (symbolic processing) allows us to learn through a single or very small number of exposures; ideal for infrequent events or novel environments.
Big Data means that computers effectively have access to vast amounts of ‘experience’, and researchers at Google have remarked on the ‘Unreasonable Effectiveness of Data’ [H09] that allows problems, such as translation, to be tackled in a statistical or sub-symbolic way which previously would have been regarded as essentially symbolic.
Google are now starting to recombine statistical techniques with more knowledge-rich techniques in order to achieve better results again. As humans we continually employ both types of thinking, so there are clear human-like lessons to be learnt, but the eventual system will not have the same ‘balance’ as a human.
If humans had developed with access to vast amounts of data and maybe other people’s experience directly (rather than through culture, books, etc.), would we have developed differently? Maybe we would do more things unconsciously that we do consciously. Maybe with enough experience we would never need to be conscious at all!
More practically, we need to decide how to make use of this additional data. For example, learning analytics is becoming an important part of educational practice. If we have an automated tutor working with a child, how should we make use of the vast body of data about other tutors interactions with other children? Should we have a very human-like tutor that effectively ‘reads’ learning analytics just as a human tutor would look at a learning ‘dashboard’? Alternatively, we might have a more loosely human-inspired ‘hive-mind’ tutor that ‘instinctively’ makes pedagogic choices based on the overall experience of all tutors, but maybe in an unexplainable way?
What could go wrong …
There have been a number of high-profile statements in the last year about the potential coming ‘singularity’ (when computers are clever enough to design new computers leading to exponential development), and warnings that computers could become sentient, Terminator-style, and take over.
There was general agreement at the workshop this kind of risk was overblown and that despite breakthroughs, such as the mastery of Go, these are still very domain limited. It is many years before we have to worry about even general intelligence in robots, let alone sentience.
A far more pressing problem is that of incapable computers, which make silly mistakes, and the way in which people, maybe because of the media attention to the success stories, assume that computers are more capable than they are!
Indeed, over confidence in algorithms is not just a problem for the general public, but also among computing academics, as I found in my personal experience on the REF panel.
There are of course many ethical and legal issues raised as we design computer systems that are more autonomous. This is already being played out with driverless cars, with issues of insurance and liability. Some legislators are suggesting allowing driverless cars, but only if there is a drive there to take control … but if the car relinquishes control, how do you safely manage the abrupt change?
Furthermore, while the vision of autonomous robots taking over the world is still far fetched; more surreptitious control is already with us. Whether it is Uber cabs called by algorithm, or simply Google’s ranking of search results prompting particular holiday choices, we all to varying extents doing “what the computer tells us”. I recall in the Dalek Invasion of Earth, the very un-human-like Daleks could not move easily amongst the rubble of war-torn London. Instead they used ‘hypnotised men’ controlled by some form of neural headset. If the Daleks had landed today and simply taken over or digitally infected a few cloud computing services would we know?
Legibility
Sometimes it is sufficient to have a ‘black box’ that makes decisions and acts. So long as it works we are happy. However, a key issue for many ethical and legal issues, but also for practical interaction, is the ability to be able to interrogate a system, so seek explanations of why a decision has been made.
Back in 1992 I wrote about these issues [D92], in the early days when neural networks and other forms of machine learning were being proposed for a variety of tasks form controlling nuclear fusion reactions to credit scoring. One particular scenario, was if an algorithm were used to pre-sort large numbers of job applications. How could you know whether the algorithms were being discriminatory? How could a company using such algorithms defend themselves if such an accusation were brought?
One partial solution then, as now, was to accept underlying learning mechanisms may involve emergent behaviour form statistical, neural network or other forms of opaque reasoning. However, this opaque initial learning process should give rise to an intelligible representation. This is rather akin to a judge who might have a gut feeling that a defendant is guilty or innocent, but needs to explicate that in a reasoned legal judgement.
This approach was exemplified by Query-by-Browsing, a system that creates queries from examples (using a variant of ID3), but then converts this in SQL queries. This was subsequently implemented [D94] , and is still running as a web demonstration.
For many years I have argued that it is likely that our ‘logical’ reasoning arises precisely form this need to explain our own tacit judgement to others. While we simply act individually, or by observing the actions of others, this can be largely tacit, but as soon as we want others to act in planned collaborate ways, for example to kill a large animal, we need to convince them. Once we have the mental mechanisms to create these explanations, these become internalised so that we end up with internal means to question our own thoughts and judgement, and even use them constructively to tackle problems more abstract and complex than found in nature. That is dialogue leads to logic!
Scenarios
We split into groups and discussed scenarios as a means to understand the potential challenges for human-like computing. Over multiple session the group I was in discussed one man scenario and then a variant.
Paramedic for remote medicine
The main scenario consisted of a patient far form a central medical centre, with an intelligent local agent communicating intermittently and remotely with a human doctor. Surprisingly the remote aspect of the scenario was not initially proposed by me thinking of Tiree, but by another member of the group thinking abut some of the remote parts of the Scottish mainland.
The local agent would need to be able communicate with the patient, be able to express a level of empathy, be able to physically examine (needing touch sensing, vision), and discuss symptoms. On some occasions, like a triage nurse, the agent might be sufficiently certain to be able to make a diagnosis and recommend treatment. However, at other times it may need to pass on to the remote doctor, being able to describe what had been done in terms of examination, symptoms observed, information gathered from the patient, in the same way that a paramedic does when handing over a patient to the hospital. However, even after the handover of responsibility, the local agent may still form part of the remote diagnosis, and maybe able to take over again once the doctor has determined an overall course of action.
The scenario embodied many aspects of human-like computing:
- The agent would require a level of emotional understanding to interact with the patient
- It would require fine and situation contingent robotic features to allow physical examination
- Diagnosis and decisions would need to be guided by rich human-inspired algorithms based on large corpora of medical data, case histories and knowledge of the particular patient.
- The agent would need to be able to explain its actions both to the patient and to the doctor. That is it would not only need to transform its own internal representations into forms intelligible to a human, but do so in multiple ways depending on the inferred knowledge and nature of the person.
- Ethical and legal responsibility are key issues in medical practice
- The agent would need to be able manage handovers of control.
- The agent would need to understand its own competencies in order to know when to call in the remote doctor.
The scenario could be in physical or mental health. The latter is particularly important given recent statistics, which suggested only 10% of people in the UK suffering mental health problems receive suitable help.
Physiotherapist
As a more specific scenario still, one fog the group related how he had been to an experienced physiotherapist after a failed diagnosis by a previous physician. Rather than jumping straight into a physical examination, or even apparently watching the patient’s movement, the physiotherapist proceeded to chat for 15 minutes about aspects of the patient’s life, work and exercise. At the end of this process, the physiotherapist said, “I think I know the problem”, and proceeded to administer a directed test, which correctly diagnosed the problem and led to successful treatment.
Clearly the conversation had given the physiotherapist a lot of information about potential causes of injury, aided by many years observing similar cases.
To do this using an artificial agent would suggest some level of:
- theory/model of day-to-day life
Thinking about the more conversational aspects of this I was reminded of the PhD work of Ramanee Peiris [P97]. This concerned consultations on sensitive subjects such as sexual health. It was known that when people filled in (initially paper) forms prior to a consultation, they were more forthcoming and truthful than if they had to provide the information face-to-face. This was even if the patient knew that the person they were about to see would read the forms prior to the consultation.
Ramanee’s work extended this first to electronic forms and then to chat-bot style discussions which were semi-scripted, but used simple textual matching to determine which topics had been covered, including those spontaneously introduced by the patient. Interestingly, the more human like the system became the more truthful and forthcoming the patients were, even though they were less so wit a real human.
As well as revealing lessons for human interactions with human-like computers, this also showed that human-like computing may be possible with quite crude technologies. Indeed, even Eliza was treated (to Weizenbaum’s alarm) as if it really were a counsellor, even though people knew it was ‘just a computer’ [W66].
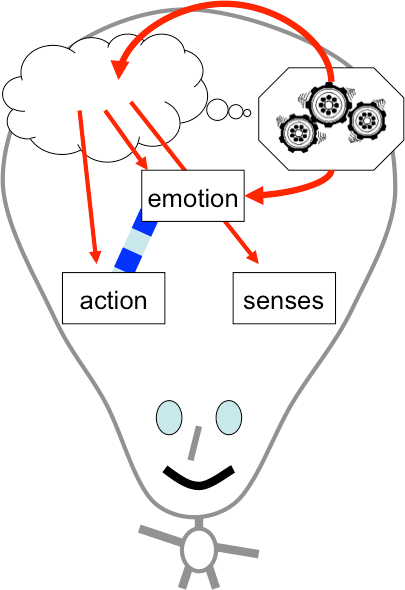
Cognition or Embodiment?
I think it fair to say that the overall balance, certainly in the group I was in, was towards the cognitivist: that is more Cartesian approach starting with understanding and models of internal cognition, and then seeing how these play out with external action. Indeed, the term ‘representation’ used repeatedly as an assumed central aspect of any human-like computing, and there was even talk of resurrecting Newells’s project for a ‘unified theory of cognition’ [N90]
There did not appear to be any hard-core embodiment theorist at the workshops, although several people who had sympathies. This was perhaps as well as we could easily have degenerated into well rehearsed arguments for an against embodiment/cognition centred explanations … not least about the critical word ‘representation’.
However, I did wonder whether a path that deliberately took embodiment centrally would be valuable. How many human-like behaviours could be modelled in this way, taking external perception-action as central and only taking on internal representations when they were absolutely necessary (Alan Clark’s 007 principle) [C98].
Such an approach would meet limits, not least the physiotherapist’s 25 minute chat, but I would guess would be more successful over a wider range of behaviours and scenarios then we would at first think.
Human–Computer Interaction and Human-Like Computing
Both Russell and myself were partly there representing our own research interest, but also more generally as part of the HCI community looking at the way human-like computing would intersect exiting HCI agendas, or maybe create new challenges and opportunities. (see poster) It was certainly clear during the workshop that there is a substantial role for human factors from fine motor interactions, to conversational interfaces and socio-technical systems design.
Russell and I presented a poster, which largely focused on these interactions.
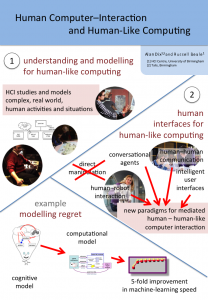
There are two sides to this:
- understanding and modelling for human-like computing — HCI studies and models complex, real world, human activities and situations. Psychological experiments and models tend to be very deep and detailed, but narrowly focused and using controlled, artificial tasks. In contrast HCI’s broader, albeit more shallow, approach and focus on realistic or even ‘in the wild’ tasks and situations may mean that we are in an ideal position to inform human-like computing.
human interfaces for human-like computing — As noted in goal (iii) we will need paradigms for humans to interact with human-like computers.
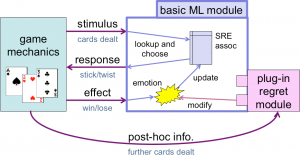
As an illustration of the first of these, the poster used my work on making sense of the apparently ‘bad’ emotion of regret [D05] .
An initial cognitive model of regret was formulated involving a rich mix of imagination (in order to pull past events and action to mind), counter-factual modal reasoning (in order to work out what would have happened), emption (which is modified to feel better or worse depending on the possible alternative outcomes), and Skinner-like low-level behavioural learning (the eventual purpose of regret).

This initial descriptive and qualitative cognitive model was then realised in a simplified computational model, which had a separate ‘regret’ module which could be plugged into a basic behavioural learning system. Both the basic system and the system with regret learnt, but the addition of regret did so with between 5 and 10 times fewer exposures. That is, the regret made a major improvement to the machine learning.
Turning to the second. Direct manipulation has been at the heart of interaction design since the PC revolution in the 1980s. Prior to that command line interfaces (or worse job control interfaces), suggested a mediated paradigm, where operators ‘asked’ the computer to do things for them. Direct manipulation changed that turning the computer into a passive virtual world of computational objects on which you operated with the aid of tools.
To some extent we need to shift back to the 1970s mediated paradigm, but renewed, where the computer is no longer like an severe bureaucrat demanding the precise grammatical and procedural request; but instead a helpful and understanding aide. For this we can draw upon existing areas of HCI such as human-human communications, intelligent user interfaces, conversational agents and human–robot interaction.
References
[C98] Clark, A. 1998. Being There: Putting Brain, Body and the World Together Again. MIT Press. https://mitpress.mit.edu/books/being-there
[D92] A. Dix (1992). Human issues in the use of pattern recognition techniques. In Neural Networks and Pattern Recognition in Human Computer Interaction Eds. R. Beale and J. Finlay. Ellis Horwood. 429-451. http://www.hcibook.com/alan/papers/neuro92/
[D94] A. Dix and A. Patrick (1994). Query By Browsing. Proceedings of IDS’94: The 2nd International Workshop on User Interfaces to Databases, Ed. P. Sawyer. Lancaster, UK, Springer Verlag. 236-248.
[D05] Dix, A..(2005). The adaptive significance of regret. (unpublished essay, 2005) https://alandix.com/academic/essays/regret.pdf
[D05b] A. Dix (2005). the brain and the web – a quick backup in case of accidents. Interfaces, 65, pp. 6-7. Winter 2005. https://alandix.com/academic/papers/brain-and-web-2005/
[D10] A. Dix, A. Katifori, G. Lepouras, C. Vassilakis and N. Shabir (2010). Spreading Activation Over Ontology-Based Resources: From Personal Context To Web Scale Reasoning. Internatonal Journal of Semantic Computing, Special Issue on Web Scale Reasoning: scalable, tolerant and dynamic. 4(1) pp.59-102. http://www.hcibook.com/alan/papers/web-scale-reasoning-2010/
[E16] EPSRC (2016). Human Like Computing Hand book. Engineering and Physical Sciences Research Council. 17 – 18 February 2016
[F16] Alison Flood (2016). Robots could learn human values by reading stories, research suggests. The Guardian, Thursday 18 February 2016 http://www.theguardian.com/books/2016/feb/18/robots-could-learn-human-values-by-reading-stories-research-suggests
[H09] Alon Halevy, Peter Norvig, and Fernando Pereira. 2009. The Unreasonable Effectiveness of Data. IEEE Intelligent Systems 24, 2 (March 2009), 8-12. DOI=10.1109/MIS.2009.36
[K10] A. Katifori, C. Vassilakis and A. Dix (2010). Ontologies and the Brain: Using Spreading Activation through Ontologies to Support Personal Interaction. Cognitive Systems Research, 11 (2010) 25–41. https://alandix.com/academic/papers/Ontologies-and-the-Brain-2010/
[N90] Allen Newell. 1990. Unified Theories of Cognition. Harvard University Press, Cambridge, MA, USA. http://www.hup.harvard.edu/catalog.php?isbn=9780674921016
[P97] DR Peiris (1997). Computer interviews: enhancing their effectiveness by simulating interpersonal techniques. PhD Thesis, University of Dundee. http://virtual.inesc.pt/rct/show.php?id=56
[W66] Joseph Weizenbaum. 1966. ELIZA—a computer program for the study of natural language communication between man and machine. Commun. ACM 9, 1 (January 1966), 36-45. DOI=http://dx.doi.org/10.1145/365153.365168
 Where are the boundaries between freedom, license and exploitation, between fair use and theft?