Fact checking Full Fact

It is hard to create accurate stories about numerical data.

Note: Even as I wrote this blog events have overtaken us.  The blog is principally about analysing how fact checking can go wrong; this will continue to be an issue, so remains relevant.  But it is also about the specific issues with FullFact.org’s discussion of the community deaths that emerged from my own modelling of university returns.  Since Full Fact’s report a new Bristol model has been published which confirms the broad patterns of my work and university cases are already growing across the UK (e.g. LIverpool,Edinburgh) with lockdowns in an increasing number of student halls (e.g. Dundee)).
It is of course nice to be able to say “I was right all along“, but in this case I wish I had been wrong.

A problem I’ve been aware of for some time is how difficult many media organisations have in formulating evidence and arguments, especially those involving numerical data.  Sometimes this is due to deliberately ‘spinning’ an issue, that is the aim is distortion.  However, at other times, in particular fact checking sites, it is clear that the intention is offer the best information, but something goes wrong.

This is an important challenge for my own academic community, we clearly need to create better tools to help media and the general public understand numerical arguments.  This is particularly important for Covid and I’ve talked and written elsewhere about this challenge.

Normally I’ve written about this at a distance, looking at news items that concern other people, but over the last month I’ve found  myself on the wrong side of media misinterpretation or maybe misinformation.  The thing that is both most fascinating (with an academic hat on) and also most concerning is the failure in the fact-checking media’s ability to create reasoned argument.

This would merely be an interesting academic case study, were it not that the actions of the media put lives at risk.

I’ve tried to write succinctly, but what follows is still quite long.  To summarise I’m a great fan of fact checking sites such as Full Fact, but I wish that fact checking sites would:

  • clearly state what they are intending to check: a fact, data, statement, the implicit implications of the statement, or a particular interpretation of a statement.
  • where possible present concrete evidence or explicit arguments, rather than implicit statements or innuendo; or, if it is appropriate to express belief in one source rather than another do this explicitly with reasons.

However, I also realise how I need better ways to communicate my own work both numerical aspects, but also textually.  I realise that often behind every sentence, rather like an iceberg, there is substantial additional evidence or discussion points.

Context

I’d been contacted by Fullfact.org at the end of August in relation to the ‘50,000 deaths due to universities’ estimate that was analysed by WonkHE and then tweeted by UCU.  This was just before the work was briefly discussed on Radio 4’s More or Less … without any prior consultation or right of reply.  So full marks to Full Fact for actually contacting the primary source!

I gave the Full Fact journalist quite extensive answers including additional data.  However, he said that assessing the assumptions was “above his pay grade” and so, when I heard no more, I’d assumed that they had decided to abandon writing about it.

Last week on a whim, just before gong on holiday, I thought to check and discovered that Fullfact.org had indeed published the story on 4th September, indeed it still has pride of place on their home page!

Sadly, they had neglected to tell me when it was published.

Front page summary – the claim

First of all let’s look at the pull out quote on the home page (as of 22nd Sept).

At the top the banner says “What was claimed”, appearing to quote from a UCU tweet and says (in quote marks):

The return to universities could cause 50,000 deaths from Covid-19 without “strong controls”

This is a slight (but critical) paraphrase of the actual UCU tweet which quoted my own paper::

“Without strong controls, the return to universities would cause a minimum of 50,000 deaths.”

The addition of “from Covid-19” is filling in context.  Pedantically (but important for a fact checking site), by normal convention this would be set in some way to make clear it is an insertion into the original text, for example [from Covid-19].  More critically, the paraphrase inverts the sentence, thus making the conditional less easy to read, replaces “would cause a minimum” with “could cause”. and sets “strong controls” in scare quotes.

While the inversion does not change the logic, it does change the emphasis.  In my own paper and UCU’s tweet the focus on the need for strong controls comes first, followed by the implications if this is not done; whereas in the rewritten quote the conditional “without strong controls” appears more like an afterthought.

On the full page this paraphrase is still set as the claim, but the text also includes the original quote.  I have no idea why they chose to rephrase what was a simple statement to start with.

Front page summary – the verdict

It appears that the large text labelled ‘OUR VERDICT’ is intended to be a partial refutation of the original quote:

The article’s author told us the predicted death toll “will not actually happen in its entirety” because it would trigger a local or national lockdown once it became clear what was happening.

This is indeed what I said!  But I am still struggling to understand by what stretch of the imagination a national lockdown could be considered anything but “strong controls“.  However, while this is not a rational argument, it is a rhetorical one, emotionally what appears to be negative statement “will not actually happenfeels as though it weakens the original statement, even though it is perfectly consonant with it.

One of the things psychologists have known for a long time is that as humans we find it hard to reason with conditional rules (if–then) if they are either abstract or disagree with one’s intuition.  This lies at the heart of many classic psychological experiments such as the Wason card test.   Fifty thousand deaths solely due to universities is hard to believe, just like the original Covid projections were back in January and February, and so we find it hard to reason clearly.

In a more day-to-day example this is clear.

Imagine a parent says to their child, “if you’re not careful you’ll break half the plates

The chid replies, “but I am being careful”.

While this is in a way a fair response to the implied rider “... and you’re not being careful enough“, it is not an argument against the parent’s original statement.

When you turn to the actual Full Fact article this difficulty of reasoning becomes even more clear.  There are various arguments posed, but none that actually challenge the basic facts, more statements that are of an emotional rhetorical nature … just like the child’s response.

In fact if Full Fact’s conclusion had been “yes this is true, but we believe the current controls are strong enough so it is irrelevant“, then one might disagree with their opinion , but it would be a coherent argument.  However, this is NOT what the site claims, certainly in its headline statements.

A lack of alternative facts

To be fair to Full Fact the most obvious way to check this estimated figure would have been to look at other models of university return and compare it with them.  It is clear such models exist as SAGE describes discussions involving such models, but neither SAGE nor indie-Sage‘s reports on university return include any estimated figure for overall impact.  My guess is that all such models end up with similar levels to those reported here and that the modellers feel that they are simply too large to be believable … as indeed I did when I first saw the outcomes of my own modelling..

Between my own first modelling in June and writing the preprint article there was a draft report from a three day virtual study group of mathematicians looking at University return, but other than this I was not aware of work in the public domain at the time. For this very reason, my paper ends with a call “for more detailed modelling“.

Happily, in the last two weeks two pre-print papers have come from the modelling group at Bristol, one with a rapid review of University Covid models and one on their own model.  Jim Dickinson has produced another of his clear summaries of them both.  The Bristol model is far more complex than those that I used including multiple types of teaching situation and many different kinds of students based on demographic and real social contact data.  It doesn’t include student–non-student infections, which I found critical in spread between households, but does include stronger effects for in-class contagion.  While very different types of modelling, the large-scale results of both suggest rapid spread within the student body.  The Bristol paper ends with a warning about potential spread to the local community, but does not attempt to quantify this, due the paucity of data on student–non-student interactions.

Crucially, the lack of systematic asymptomatic testing will also make it hard to assess the level of Covid spread within the student population during the coming autumn and also hard to retrospectively assess the extent to which this was a critical factor in the winter Covid spread in the wider population.  We may come to this point in January and still not have real data.

Full page headlines

Following through to the full page on Full Fact, the paraphrased ‘claim’ is repeated with Full Fact’s ‘conclusion’ … which is completely different from the front page ‘OUR VERDICT’.

The ‘conclusion’ is carefully stated – rather like Boris Johnson’s careful use of the term ‘controlled by’ when describing the £350 million figure on the Brexit bus.  It does not say here whether Full Fact believes the (paraphrased) claim, but they merely make a statement relating to it.  In fact at the end of the article there is rather more direct conclusion berating UCU for tweeting the figure.  That is Full Fact do have a strong conclusion, and one that is far more directly related to the reason for fact checking this in the first place, but instead of stating this explicitly, the top of page headline ‘conclusion’ in some sense sits on the fence.

However, even this ‘sit on the fence’ statement is at very least grossly misleading and in reality manifestly false.

The first sentence:

This comes from a research paper that has not been peer-reviewed

is correct, and one of the first things I pointed out when Full Fact contacted me.  Although the basic mathematics was read by a colleague, the paper itself has not been through formal peer review, and given the pace of change will need to be changed to be retrospective before it will be.  This said, in my youth I was a medal winner in the International Mathematical Olympiad and I completed my Cambridge mathematics degree in two years; so I do feel somewhat confident in the mathematics itself!  However, one of the reasons for putting the paper on the preprint site arXiv was to make it available for critique and further examination.

The second statement is not correct.  The ‘conclusion’ states that

It is based on several assumptions, including that every student gets infected, and nothing is done to stop it.

IF you read the word “it” to refer to the specific calculation of 50,000 deaths then this is perhaps debatable.  However, the most natural reading is that “it” refers to the paper itself, and this interpretation is reinforced later in the Full Fact text, which says “the article [as in my paper] assumes …”.  This statement is manifestly false.

The paper as a whole models student bubbles of different sizes, and assumes precisely the opposite, that is assuming rapid spread only within bubbles.  That is it explicitly assumes that something (bubbles) is done to stop it. The outcome of the models, taking a wide range of scenarios, is that in most circumstances indirect infections (to the general population and back) led to all susceptible students being infected.  One can debate the utility or accuracy of the models, but crucially “every student gets infected” is a conclusion not an assumption of the models or the paper as a whole.

To be fair on Full Fact this confusion between the fundamental assumptions of the paper and the specific values used for this one calculation is echoing Kit Yates initial statements when he appeared on More or Less. I’m still not sure whether that was a fundamental misunderstanding or a slip of the tongue during the interview and my attempts to obtain clarification have failed.  However, I did explicitly point this distinction out to Full Fact.

The argument

The Full Fact text consists of two main parts.  One is labelled “Where did “50,000 deaths” come from?”, which is ostensibly a summary of my paper, but in reality seems to be where there are the clearest fact-check style statements.  The second is labelled “But will this happen?” which sounds as if this is the critique.  However, it is actually three short paragraphs the first two effectively setting me and Kit Yates head-to-head and the third is the real conclusion which says that UCU tweeted the quote without context.

Oddly I was never asked whether I believed that the UCU’s use of the statement was consistent with the way in which it was derived in my work.  This does seem a critical question given that Full Fact’s final conclusion is that UCU quoted it out of context. Indeed, while the Full Fact claims that UCU tweeted “the quote without context“, within the length of a tweet the UCU both included the full quote (not paraphrased!) and directly referenced Jim Dickinson’s summary of my paper on WonkHE, which itself links to my paper.  That is the UCU tweet backed up the statement with links that lead to primary data and sources.

As noted the actual reasoning is odd as the body of the argument, to the extent it exists, appears to be in the section that summarises the paper.

First section – summary of paper

The first section “Where did “50,000 deaths” come from?”, starts off by summarising the assumptions underlying the 50,000 figure being fact checked and is the only section that links to any additional external sources.  Given the slightly askance way it is framed, it is hard to be sure, but it appears that this description is intended to cast doubt on the calculations because of the extent of the assumptions.  This is critical as it is the assumptions which Kit Yates challenged.

In several cases the assumptions stated are not what is said in the paper.  For example, Full Fact says the paper “assumes no effect from other measures already in place, like the Test and Trace system or local lockdowns” whereas the paragraph directly above the crucial calculation explicitly says that (in order to obtain a conservative estimate) the initial calculation will optimistically assume “social distancing plus track and trace can keep the general population R below 1 during this period“.  The 50,000 figure does not include additional more extensive track and trace within the student community, but so far this is no sign of this happening beyond one or two universities adopting their own testing, and this is precisely one of the ‘strong controls’ that the paper explicitly suggests.

Ignoring these clear errors, the summary of assumptions made by the calculation of the 50,000 figure says that I “include the types of hygiene and social distancing measures already being planned, but not stronger controls” and then goes on to list the things not included. It does seem obvious and is axiomatic that a calculation of what will happen “without strong controls” must assume for the purposes of the calculation that there are no strong controls.

The summary section also spends time on the general population R value of 0.7used in the calculation and the implications of this.  The paragraph starts “In addition to this” and quotes that this is my “most optimistic” figure. This is perfectly accurate … but the wording seems to imply this is perhaps (another!) unreasonable assumption … and indeed it is crazily low.  At the time (soon after lockdown) it was still hoped that non-draconian measures (such as track and trace) could keep R below 1, but of course we have seen rises far beyond this and the best estimates for coming winter are now more like 1.2 to 1.5.

Note however the statement was “Without strong controls, the return to universities would cause a minimum of 50,000 deaths.”  That is the calculation was deliberately taking some mid-range estimates of things and some best case ones in order to yield a lower bound figure.  If one takes a more reasonable R the final figure would be a lot larger than 50,000.

Let’s think again of the child, but let’s make the child a stroppy teenager:

Parent, “if you’re not careful you’ll break half the plates

Child replies, throwing the pile of plates to the floor, “no I’ll break them all.”

The teenager might be making a point, but is not invalidating the parent’s statement.

Maybe I am misinterpreting the intent behind this section, but given the lack of any explicit fact-check evidence elsewhere, it seems reasonable to treat this as at least part of the argument for the final verdict.

Final section – critique of claim

As noted, the second section “But will this happen?”, which one would assume is the actual critique and mustering of evidence, consists of three paragraphs: one quoting me, one quoting Kit Yates of Bath, and one which appears to be the real verdict.

The first paragraph is the original statement that appeared as ‘OUR VERDICT’ on the first page where I say that 50,000 deaths will almost certainly not occur in full because the government will be forced to take some sort of action once general Covid growth and death rates rise.  As noted if this is not ‘strong controls‘ what is?

The second paragraph reports Kit Yates as saying there are some mistakes in my model and is quoted as generously saying that he’s “not completely damning the work,”.  While grateful for his restraint, some minimal detail or evidence would be useful to assess his assertion.  On More or Less he questioned some of the values used and I’ve addressed that previously;  it is not clear whether this is what is meant by ‘mistakes’ here.  I don’t know if he gave any more information to Full Fact, but if he has I have not seen it and Full Fact have not reported it.

A tale of three verdicts

As noted the ‘verdict’ on the Full Fact home page is different from the ‘conclusion’ at the top of the main fact-check page, and in reality it appears the very final paragraph of the article is the real ‘verdict’.

Given this confusion about what is actually being checked, it is no wonder the argument itself is somewhat confused.

The final paragraph, the Full Fact verdict itself has three elements:

  • that UCU did not tweet the quote in context – as noted perhaps a little unfair in a tweeted quote that links to its source
  • that the 50,000 “figure comes from a model that is open to question” – well clearly there is question in Kit Yates’ quote, but this would have more force if it were backed by evidence.
  • that it is based on “predictions that will almost certainly not play out in the real world

The last of these is the main thrust of the ‘verdict’ quote on the Full Fact home page.  Indeed there is always a counterfactual element to any actionable prediction.  Clearly if the action is taken the prediction will change.  This is on the one hand deep philosophy, but also common sense.

The Imperial Covid model that prompted (albeit late) action by government in March gave a projection of between a quarter and a half million deaths within the year if the government continued a policy of herd immunity.  Clearly any reasonable government that believes this prediction will abandon herd immunity as a policy and indeed this appears to have prompted a radical change of heart.  Given this, one could have argued that the Imperial predictions “will almost certainly not play out in the real world“.  This is both entirely true and entirely specious.

The calculations in my paper and the quote tweeted by UCU say:

Without strong controls, the return to universities would cause a minimum of 50,000 deaths.”

That is a conditional statement.

Going back to the child; the reason the parent says ““if you’re not careful you’ll break half the plates“, is not as a prediction that half the plates will break, but an encouragement to the child to be careful so that the plates will not break.  If the child is careful and the plates are not broken, that does not invalidate the parent’s warning.

Last words

Finally I want to reiterate how much I appreciate the role of fact checking sites including Full Fact and also fact checking parts of other news sites as as BBC’s Reality Check; and I am sure the journalist here wanted to produce a factual article. However, in order to be effective they need to be reliable.  We are all, and journalists especially, aware that an argument needs to be persuasive (rhetoric), but for fact checking and indeed academia, arguments also need to be accurate and analytic (reason).

There are specific issues here and I am angered at some of the misleading aspects of this story because of the importance of the issues; there are literally lives at stake.

However, putting this aside, the story raises the challenge for me as to how we can design tools and methods to help both those working on fact checking sites and the academic community, to create and communicate clear and correct argument.



Free AI book and a new one coming …

Yes a new AI book is coming … but until then you can download the first edition for FREE 🙂

Many years ago Janet Finlay and I wrote a small introduction to artificial intelligence.  At the time there were several Bible-sized tomes … some of which are still the standard textbooks today.  However, Janet was teaching a masters conversion course and found that none of these books were suitable for taking the first steps on an AI journey, especially for those coming from non-computing disciplines.

Over the years it faded to the back of our memories, with the brief exception of the time when, after we’d nearly forgotten it, CRC Press issued a Japanese translation.  Once or twice the thought of doing an update arose, but quickly passed.  This was partly because our main foci were elsewhere, but also, at the danger of insulting all my core-AI friends, not much changed in core AI for many years!

Coming soon … Second Edition

Of course over recent years things have changed dramatically, hence my decision, nearly 25 years on, to create a new edition maintaining the aim to give a rich but accessible introduction, but capturing some of the recent trends and giving these a practical and human edge.  Following the T-model of teaching, I’d like to help both newcomer and expert gain a broad perspective of the issues and landscape, whilst giving enough detail for those that want to delve into a more specific area.

A Free Book and New Resources

In the mean time the publisher, Taylor & Francis/CRC has agreed to make the PDF of the first edition available free of charge  I have updated some of the code examples from the first edition and will be incrementally adding new material to the second edition micro-site including slides, cases studies, video and interactive materials.  If you’d like to teach using this please let me know your views on the topics and also if there are areas where you’d like me to create preliminary material with greater urgency.  I won’t promise to be able to satisfy everyone, but can use this to adjust my priorities.

Why now?

The first phase of change in AI was driven by the rise of big data and the increasing use of forms of machine learning to drive adverts, search results and social media.  Within user interface design, many of the fine details of colour choices and screen layout are now performed using A–B testing …sight variants of interfaces delivered to millions of people – shallow, without understanding and arguably little more than bean counting, but in numerous areas vast data volume has been found to be ‘unreasonably effective‘ at solving problems that were previously seen to be the remit of deep AI.

In the last few years deep learning has taken over as the driver of AI research and often also media hype.  Here it has been the sheer power of computation, partly due to Moores’ Law with computation nearly a million times faster than it was when that first edition was written nearly 25 years ago.  However, it has also been enabled by cloud computing allowing large numbers of computers ti efficiently attack a single problem.  Algorithms that might have been conceived of but dismissed as impractical in the past have become commonplace.

Alongside this has been a dark side of AI, from automated weapons and mass surveillance, to election rigging and the insidious knowledge that large corporations have gathered through our day-to-day web interactions.  In the early 1990s I warned of the potential danger of ethnic and gender bias in black-box machine learning and I’ve returned to this issue more recently as those early predictions have come to pass.

Across the world there are new courses running or being planned and people who want to know more.  In Swansea we have a PhD programme on people-first AI/big data, and there is currently a SIGCHIItaly workshop call out for Teaching HCI for AI: Co-design of a Syllabus. There are several substantial textbooks that offer copious technical detail, but can be inaccessible for the newcomer or those coming from other disciplines.  There are also a number of excellent books that deal with the social and human impact of AI, but without talking about how it works.

I hope to be able to build upon the foundations that Janet and I established all those years ago to create something that fills a crucial gap: giving a human-edge to those learning artificial intelligence from a computing background and offering an accessible technical introduction for those approaching the topic from other disciplines.


Software for 2050

New Year’s resolutions are for a year ahead, but with the start of a new decade it is worth looking a bit further.
How many of the software systems we use today will be around in 2050 — or even 2030?
Story 1.  This morning the BBC reported that NHS staff need up to 15 different logins to manage ‘outdated’ IT systems and I have seen exactly this in a video produced by a local hospital consultant. Another major health organisation I talked to mentioned that their key systems are written in FoxBase Pro, which has not been supported by Microsoft for 10 years.
Story 2.  Nearly all worldwide ATM transactions are routed through systems that include COBOL code (‘natural language’ programming of the 1960s) … happily IBM still do support CICS, but there is concern that COBOL expertise is literally dying out.
Story 3.  Good millennial tech typically involves an assemblage of cloud-based services: why try to deal with images when you have Flickr … except Flickr is struggling to survive financially; why have your own version control system when you can use Google Code, except Google Code shut down in 2016 after 10 years.
Story 3a.  Google have a particularly bad history of starting or buying services and then dropping them: Freebase (sigh), Revolv Hub home automation, too many to list. They are doing their best with AngularJS, which has a massive uptake in hi-tech, and is being put into long-term maintenance mode — however, ‘long-term’ here will not mean COBOL long-term, just a few years of critical security updates.
Story 4.  Success at last. Berners-Lee did NOT build the web on cutting edge technology (an edge of sadness here as hypertext research, including external linkage, pretty much died in 1994), and because of this it has survived and probably will still be functioning in 2050.
Story 5.  I’m working with David Frohlich and others who have been developing slow, meaningful social media for the elderly and their families. This could potentially contribute to very long term domestic memories, which may help as people suffer dementia and families grieve after death. However, alongside the design issues for such long-term interaction, what technical infrastructure will survive a current person’s lifetime?
You can see the challenge here.  Start-ups are about creating something that will grow rapidly in 2–5 years, but then be sold, thrown away or re-engineered from scratch.  Government and health systems need to run for 30 years or more … as do our personal lives.
What practical advice do we give to people designing now for systems that are likely to still be in use in 2050?

physigrams – modelling the device unplugged

Physigrams get their own micro-site!

See it now at at physicality.org/physigrams

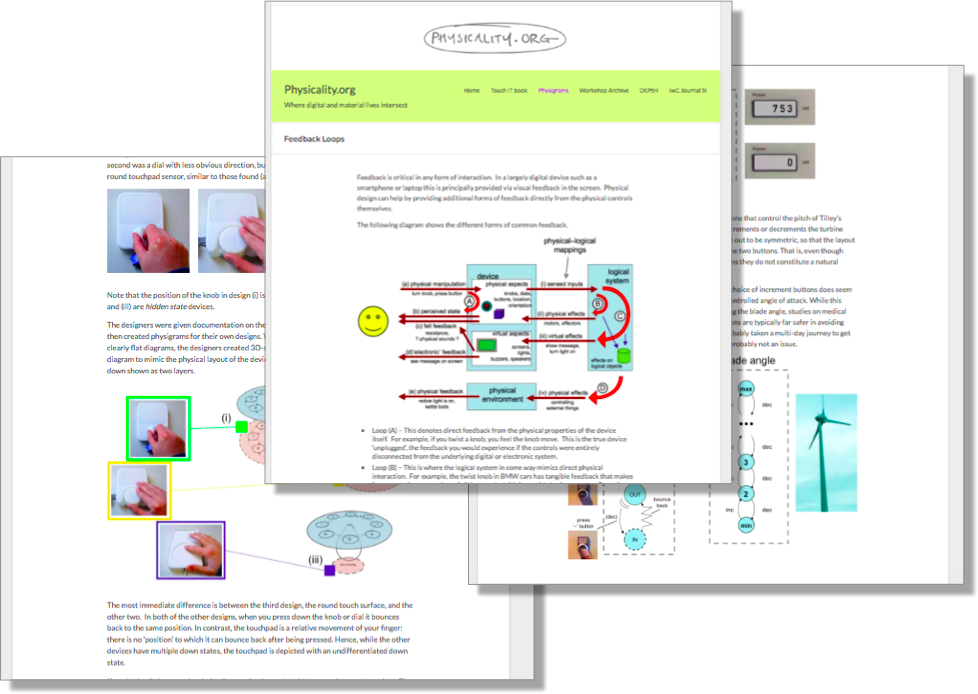
Appropriate physical design can make the difference between an intuitively obvious device and one that is inscrutable.  Physigrams are a way of modelling and analysing the interactive physical characteristics of devices from TV remotes to electric kettles, filling the gap between foam prototypes and code.

Sketches or CAD allow you to model the static physical form of the device, and this can be realised in moulded blue foam, 3D printing or cardboard mock-ups.  Prototypes of the internal digital behaviour can be produced using tools such as Adobe Animate, proto.io or atomic or as hand-coded using standard web-design tools.  The digital behaviour can also be modelled using industry standard techniques such as UML.


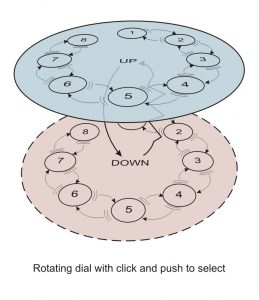
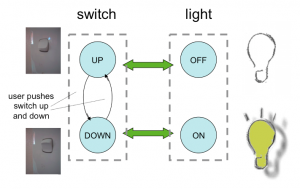
Physigrams allow you to model the ‘device unplugged’ – the pure physical interaction potential of the device: the ways you can interact with buttons, dials and knobs, how you can open, slide or twist movable elements.  These physigrams can be attached to models of the digital behaviour to understand how well the physical and digital design compliment one another.

Physigrams were developed some years ago as part of the DEPtH project., a collaboration between product designers at Cardiff School of Art and Design and  computer scientists at Lancaster University. Physigrams have been described in various papers over the years.  However, with TouchIT ,our book on physicality and design (eventually!) reaching completion and due out next year, it felt that physigrams deserved a home of their own on the web.

The physigram micro-site, part of physicality.org includes descriptions of physical interaction properties, a complete key to the physigram notation, and many examples of physigrams in action from light switches, to complete control panels and novel devices.

Timing matters!

How long is an instant? The answer, of course, is ‘it depends’, but I’ve been finding it fascinating playing on the demo page for AngularJS tooltips. and seeing what feels like ‘instant’ for a tooltip.

The demo allows you to adjust the md-delay property so you can change the delay between hovering over a button and the tooltip appearing, and then instantly see what that feels like.

Try it yourself, set a time and then either move over the button as if you were about to click t, or wondering what it does, or simply pass over it as if you were moving your pointer to another part of the page.
 
If the delay is too short (e.g. 0), the tooltip flickers as you simply pass over the icon.
 
If you want it as a backup for when someone forgets the action, then something longer about a second is fine – the aim is to be there only if the user has that moment doubt.
 
However, I was fascinated by how long the delay needed to be to feel ‘instant’ and yet not appear by accident.
 
For me about 150 ms is not noticeable as a delay, whereas 200ms I can start to notice – not an annoying delay, but a very slight sense of lack of responsiveness.

Students love digital … don’t they?

In the ever accelerating rush to digital delivery, is this actually what students want or need?

Last week I was at Talis Insight conference. As with previous years, this is a mix of sessions focused on those using or thinking of using Talis products, with lots of rich experience talks. However, also about half of the time is dedicated to plenaries about the current state and future prospects for technology in higher education; so well worth attending (it is free!) whether or not you are a Talis user.

Speakers this year included Bill Rammell, now Vice-Chancellor at the University of Bedfordshire, but who was also Minister of State for Higher Education during the second Blair government, and during that time responsible for introducing the National Student Survey.

Another high profile speaker was Rosie Jones, who is Director of Library Services at the Open University … which operates somewhat differently from the standard university library!

However, among the VCs, CEOs and directors of this and that, it was the two most junior speakers who stood out for me. Eva Brittin-Snell and Alex Davie are to SAGE student scholars from Sussex. As SAGE scholars they have engaged in research on student experience amongst their peers, speak at events like this and maintain a student blog, which includes, amongst other things the story of how Eva came to buy her first textbook.

Eva and Alex’s talk was entitled “Digital through a student’s eyes” (video). Many of the talks had been about the rise of digital services and especially the eTextbook. Eva and Alex were the ‘digital natives’, so surely this was joy to their ears. Surprisingly not.

Alex, in her first year at university, started by alluding to the previous speakers, the push for book-less libraries, and general digital spiritus mundi, but offered an alternative view. Students were annoyed at being asked to buy books for a course where only a chapter or two would be relevant; they appreciated the convenience of an eBook, when core textbooks were permanently out on and, and instantly recalled once one got hold of them. However, she said they still preferred physical books, as they are far more usable (even if heavy!) than eBooks.

Eva, a fourth year student, offered a different view. “I started like Aly”, she said, and then went on to describe her change of heart. However, it was not a revelation of the pedagogical potential of digital, more that she had learnt to live through the pain. There were clear practical and logistic advantages to eBooks, there when and where you wanted, but she described a life of constant headaches from reading on-screen.

Possibly some of this is due to the current poor state of eBooks that are still mostly simply electronic versions of texts designed for paper. Also, one of their student surveys showed that very few students had eBook readers such as Kindle (evidently now definitely not cool), and used phones primarily for messaging and WhatsApp. The centre of the student’s academic life was definitely the laptop, so eBooks meant hours staring at a laptop screen.

However, it also reflects a growing body of work showing the pedagogic advantages of physical note taking, potential developmental damage of early tablet and smartphone use, and industry figures showing that across all areas eBook sales are dropping and physical book sales increasing. In addition there is evidence that children and teenagers people prefer physical books, and public library use by young people is growing.

It was also interesting that both Alex and Eva complained that eTextbooks were not ‘snappy’ enough. In the age of Tweet-stream presidents and 5-minute attention spans, ‘snappy’ was clearly the students’ term of choice to describe their expectation of digital media. Yet this did not represent a loss of their attention per se, as this was clearly not perceived as a problem with physical books.

… and I am still trying to imagine what a critical study of Aristotle’s Poetics would look like in ‘snappy’ form.

There are two lessons from this for me. First what would a ‘digital first’ textbook look like. Does it have to be ‘snappy’, or are there ways to maintain attention and depth of reading in digital texts?

The second picks up on issues in the co-authored paper I presented at NordiChi last year, “From intertextuality to transphysicality: The changing nature of the book, reader and writer“, which, amongst other things, asked how we might use digital means to augment the physical reading process, offering some of the strengths of eBooks such as the ability to share annotations, but retaining a physical reading experience.  Also maybe some of the physical limitations of availability could be relieved, for example, if university libraries work with bookshops to have student buy and return schemes alongside borrowing?

It would certainly be good if students did not have to learn to live with pain.

We have a challenge.

Sandwich proofs and odd orders

Revisiting an old piece of work I reflect on the processes that led to it: intuition and formalism, incubation and insight, publish or perish, and a malaise at the heart of current computer science.

A couple of weeks ago I received an email requesting an old technical report, “Finding fixed points in non-trivial domains: proofs of pending analysis and related algorithms” [Dx88].  This report was from nearly 30 years ago, when I was at York and before the time when everything was digital and online. This was one of my all time favourite pieces of work, and one of the few times I’ve done ‘real maths’ in computer science.

As well as tackling a real problem, it required new theoretical concepts and methods of proof that were generally applicable. In addition it arose through an interesting story that exposes many of the changes in academia.

[Aside, for those of more formal bent.] This involved proving the correctness of an algorithm ‘Pending Analysis’ for efficiently finding fixed points over finite lattices, which had been developed for use when optimising functional programs. Doing this led me to perform proofs where some of the intermediate functions were not monotonic, and to develop forms of partial order that enabled reasoning over these. Of particular importance was the concept of a pseudo-monotonic functional, one that preserved an ordering between functions even if one of them is not itself monotonic. This then led to the ability to perform sandwich proofs, where a potentially non-monotonic function of interest is bracketed between two monotonic functions, which eventually converge to the same function sandwiching the function of interest between them as they go.

Oddly while it was one my favourite pieces of work, it was at the periphery of my main areas of work, so had never been published apart from as a York technical report. Also, this was in the days before research assessment, before publish-or-perish fever had ravaged academia, and when many of the most important pieces of work were ‘only’ in technical report series. Indeed, our Department library had complete sets of many of the major technical report series such as Xerox Parc, Bell Labs, and Digital Equipment Corporation Labs where so much work in programming languages was happening at the time.

My main area was, as it is now, human–computer interaction, and at the time principally the formal modelling of interaction. This was the topic of my PhD Thesis and of my first book “Formal Methods for Interactive Systems” [Dx91] (an edited version of the thesis).   Although I do less of this more formal work now-a-days, I’ve just been editing a book with Benjamin Weyers, Judy Bowen and Philippe Pallanque, “The Handbook of Formal Methods in Human-Computer Interaction” [WB17], which captures the current state of the art in the topic.

Moving from mathematics into computer science, the majority of formal work was far more broad, but far less deep than I had been used to. The main issues were definitional: finding ways to describe complex phenomena that both gave insight and enabled a level of formal tractability. This is not to say that there were no deep results: I recall the excitement of reading Sannella’s PhD Thesis [Sa82] on the application of category theory to formal specifications, or Luca Cardelli‘s work on complex type systems needed for more generic coding and understanding object oriented programing.

The reason for the difference in the kinds of mathematics was that computational formalism was addressing real problems, not simply puzzles interesting for themselves. Often these real world issues do not admit the kinds of neat solution that arise when you choose your own problem — the formal equivalent of Rittel’s wicked problems!

Crucially, where there were deep results and complex proofs these were also typically addressed at real issues. By this I do not mean the immediate industry needs of the day (although much of the most important theoretical work was at industrial labs); indeed functional programming, which has now found critical applications in big-data cloud computation and even JavaScript web programming, was at the time a fairly obscure field. However, there was a sense in which these things connected to a wider sphere of understanding in computing and that they could eventually have some connection to real coding and computer systems.

This was one of the things that I often found depressing during the REF2014 reading exercise in 2013. Over a thousand papers covering vast swathes of UK computer science, and so much that seemed to be in tiny sub-niches of sub-niches, obscure variants of inconsequential algebras, or reworking and tweaking of algorithms that appeared to be of no interest to anyone outside two or three other people in the field (I checked who was citing every output I read).

(Note the lists of outputs are all in the public domain, and links to where to find them can be found at my own REF micro-site.)

If this had been pure mathematics papers it is what I would have expected; after all mathematics is not funded in the way computer science is, so I would not expect to see the same kinds of connection to real world issues. Also I would have been disappointed if I had not seen some obscure work of this kind; you sometimes need to chase down rabbit holes to find Aladdin’s cave. It was the shear volume of this kind of work that shocked me.

Maybe in those early days, I self-selected work that was both practically and theoretically interesting, so I have a golden view of the past; maybe it was simply easier to do both before the low-hanging fruit had been gathered; or maybe just there has been a change in the social nature of the discipline. After all, most early mathematicians happily mixed pure and applied mathematics, with the areas only diverging seriously in the 20th century. However, as noted, mathematics is not funded so heavily as computer science, so it does seem to suggest a malaise, or at least loss of direction for computing as a discipline.

Anyway, roll back to the mid 1980s. A colleague of mine, David Wakeling, had been on a visit to a workshop in the States and heard there about Pending Analysis and Young and Hudak’s proof of its correctness . He wanted to use the algorithm in his own work, but there was something about the proof that he was unhappy about. It was not that he had spotted a flaw (indeed there was one, but obscure), but just that the presentation of it had left him uneasy. David was a practical computer scientist, not a mathematician, working on compilation and optimisation of lazy functional programming languages. However, he had some sixth sense that told him something was wrong.

Looking back, this intuition about formalism fascinates me. Again there may be self-selection going on, if David had had worries and they were unfounded, I would not be writing this. However, I think that there was something more than this. Hardy and Wright, the bible of number theory , listed a number of open problems in number theory (many now solved), but crucially for many gave an estimate on how likely it was that they were true or might eventually have a counter example. By definition, these were non-trivial hypotheses, and either true or not true, but Hardy and Wright felt able to offer an opinion.

For David I think it was more about the human interaction, the way the presenters did not convey confidence.  Maybe this was because they were aware there was a gap in the proof, but thought it did not matter, a minor irrelevant detail, or maybe the same slight lack of precision that let the flaw through was also evident in their demeanour.

In principle academia, certainly in mathematics and science, is about the work itself, but we can rarely check each statement, argument or line of proof so often it is the nature of the people that gives us confidence.

Quite quickly I found two flaws.

One was internal to the mathematics (math alert!) essentially forgetting that a ‘monotonic’ higher order function is usually only monotonic when the functions it is applied to are monotonic.

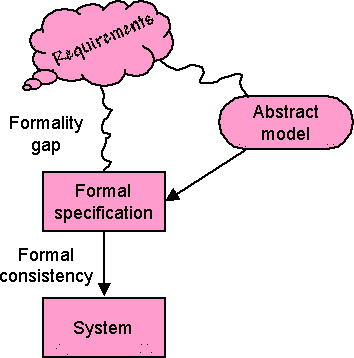
The other was external — the formulation of the theorem to be proved did not actually match the real-world computational problem. This is an issue that I used to refer to as the formality gap. Once you are in formal world of mathematics you can analyse, prove, and even automatically check some things. However, there is first something more complex needed to adequately and faithfully reflect the real world phenomenon you are trying to model.

I’m doing a statistics course at the CHI conference in May, and one of the reasons statistics is hard is that it also needs one foot on the world of maths, but one foot on the solid ground of the real world.

Finding the problem was relatively easy … solving it altogether harder! There followed a period when it was my pet side project: reams of paper with scribbles, thinking I’d solved it then finding more problems, proving special cases, or variants of the algorithm, generalising beyond the simple binary domains of the original algorithm. In the end I put it all into a technical report, but never had the full proof of the most general case.

Then, literally a week after the report was published, I had a notion, and found an elegant and reasonably short proof of the most general case, and in so doing also created a new technique, the sandwich proof.

Reflecting back, was this merely one of those things, or a form of incubation? I used to work with psychologists Tom Ormerod and Linden Ball at Lancaster including as part of the Desire EU network on creativity. One of the topics they studied was incubation, which is one of the four standard ‘stages’ in the theory of creativity. Some put this down to sub-conscious psychological processes, but it may be as much to do with getting out of patterns of thought and hence seeing a problem in a new light.

In this case, was it the fact that the problem had been ‘put to bed’, enabled fresh insight?

Anyway, now, 30 years on, I’ve made the report available electronically … after reanimating Troff on my Mac … but that is another story.

References

[Dx91] A. J. Dix (1991). Formal Methods for Interactive Systems. Academic Press.ISBN 0-12-218315-0 http://www.hiraeth.com/books/formal/

[Dx88] A. J. Dix (1988). Finding fixed points in non-trivial domains: proofs of pending analysis and related algorithms. YCS 107, Dept. of Computer Science, University of York. https://alandix.com/academic/papers/fixpts-YCS107-88/

[HW59] G.H. Hardy, E.M. Wright (1959). An Introduction to the Theory of Numbers – 4th Ed. Oxford University Press.   https://archive.org/details/AnIntroductionToTheTheoryOfNumbers-4thEd-G.h.HardyE.m.Wright

[Sa82] Don Sannella (1982). Semantics, Imlementation and Pragmatics of Clear, a Program Specification Language. PhD, University of Edinburgh. https://www.era.lib.ed.ac.uk/handle/1842/6633

[WB17] Weyers, B., Bowen, J., Dix, A., Palanque, P. (Eds.) (2017) The Handbook of Formal Methods in Human-Computer Interaction. Springer. ISBN 978-3-319-51838-1 http://www.springer.com/gb/book/9783319518374

[YH96] J. Young and P. Hudak (1986). Finding fixpoints on function spaces. YALEU/DCS/RR-505, Yale University, Department of Computer Science http://www.cs.yale.edu/publications/techreports/tr505.pdf

the educational divide – do numbers matter?

If a news article is all about numbers, why is the media shy about providing the actual data?

On the BBC News website this morning James McIvor‘s article “Clash over ‘rich v poor’ university student numbers” describes differences between Scottish Government (SNP) and Scottish Labour in the wake of Professor Peter Scott appointment as commissioner for fair access to higher education in Scotland.

Scottish Labour claim that while access to university by the most deprived has increased, the educational divide is growing, with the most deprived increasing by 0.8% since 2014, but those in the least deprived (most well off) growing at nearly three times that figure.  In contrast, the Sottish Government claims that in 2006 those from the least deprived areas were 5.8 times more likely to enter university than those in the most deprived areas, whereas now the difference is only 3.9 times, a substantial decrease in educational inequality..

The article is all about numbers, but the two parties seem to be saying contradictory things, one saying inequality is increasing, one saying it is decreasing!

Surely enough to make the average reader give up on experts, just like Michael Gove!

Of course, if you can read through the confusing array of leasts and mosts, the difference seems to be that the two parties are taking different base years: 2014 vs 2006, and that both can be true: a long term improvement with decreasing inequality, but a short term increase in inequality since 2014.  The former is good news, but the latter may be bad news, a change in direction that needs addressing, or simply ‘noise’ as we are taking about small changes on big numbers.

I looked in vain for a link to the data, web sites or reports n which this was based, after all this is an article where the numbers are the story, but there are none.

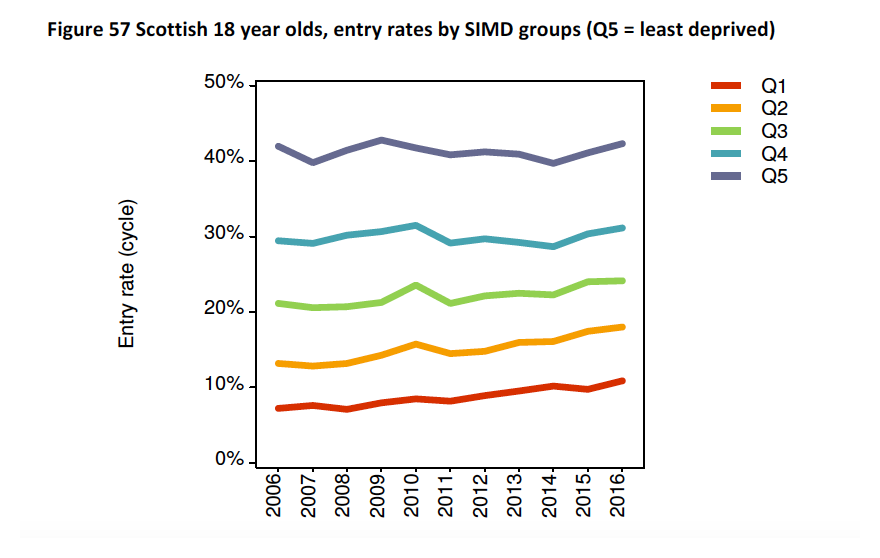
After a bit of digging, I found that the data that both are using is from the UCAS Undergraduate 2016 End of Cycle Report (the numerical data for this figure and links to CSV files are below).

Figure from UCAS 2016 End of Cycle Report

Looking at these it is clear that the university participation rate for the least deprived quintile (Q5, blue line at top) has stayed around 40% with odd ups and downs over the last ten years, whereas the participation of the most deprived quintile has been gradually increasing, again with year-by-year wiggles.  That is the ratio between least and most deprived used to be about 40:7 and now about 40:10, less inequality as the SNP say.

For some reason 2014 was a dip year for the Q5.  There is no real sign of a change in the long-term trend, but if you take 2014 to 2016, the increase in Q5 is larger than the increase in Q1, just as Scottish Labour say.  However, any other year would not give this picture.

In this case it looks like Scottish Labour either cherry picked a year that made the story they wanted, or simply accidentally chose it.

The issue for me though, is not so much who was right or wrong, but why the BBC didn’t present this data to make it possible to make this judgement?

I can understand the argument that people do not like, or understand numbers at all, but where, as in this case, the story is all about the numbers, why not at least present the raw data and ideally discuss why there is an apparent contradiction!


Numerical from figure 57 of UCAS  2016 End of Cycle Report

2006 2007 2008 2009 2010 2011 2012 2013 2014 2015 2016
Q1 7.21 7.58 7.09 7.95 8.47 8.14 8.91 9.52 10.10 9.72 10.90
Q2 13.20 12.80 13.20 14.30 15.70 14.40 14.80 15.90 16.10 17.40 18.00
Q3 21.10 20.60 20.70 21.30 23.60 21.10 22.10 22.50 22.30 24.00 24.10
Q4 29.40 29.10 30.20 30.70 31.50 29.10 29.70 29.20 28.70 30.30 31.10
Q5 42.00 39.80 41.40 42.80 41.70 40.80 41.20 40.90 39.70 41.10 42.30

UCAS provide the data in CSV form.  I converted this to the above tabular form and this is available in CSV or XLSX.

the internet laws of the jungle

firefox-copyright-1Where are the boundaries between freedom, license and exploitation, between fair use and theft?

I found myself getting increasingly angry today as Mozilla Foundation stepped firmly beyond those limits, and moreover with Trump-esque rhetoric attempts to dupe others into following them.

It all started with a small text add below the Firefox default screen search box:

firefox-copyright-2

Partly because of my ignorance of web-speak ‘TFW‘ (I know showing my age!), I clicked through to a petition page on Mozilla Foundation (PDF archive copy here).

It starts off fine, with stories of some of the silliness of current copyright law across Europe (can’t share photos of the Eiffel tower at night) and problems for use in education (which does in fact have quite a lot of copyright exemptions in many countries).  It offers a petition to sign.

This sounds all good, partly due to rapid change, partly due to knee jerk reactions, internet law does seem to be a bit of a mess.

If you blink you might miss one or two odd parts:

“This means that if you live in or visit a country like Italy or France, you’re not permitted to take pictures of certain buildings, cityscapes, graffiti, and art, and share them online through Instagram, Twitter, or Facebook.”

Read this carefully, a tourist forbidden from photographing cityscapes – silly!  But a few words on “… and art” …  So if I visit an exhibition of an artist or maybe even photographer, and share a high definition (Nokia Lumia 1020 has 40 Mega pixel camera) is that OK? Perhaps a thumbnail in the background of a selfie, but does Mozilla object to any rules to prevent copying of artworks?

mozilla-dont-break-the-internet

However, it is at the end, in a section labelled “don’t break the internet”, the cyber fundamentalism really starts.

“A key part of what makes the internet awesome is the principle of innovation without permission — that anyone, anywhere, can create and reach an audience without anyone standing in the way.”

Again at first this sounds like a cry for self expression, except if you happen to be an artist or writer and would like to make a living from that self-expression?

Again, it is clear that current laws have not kept up with change and in areas are unreasonably restrictive.  We need to be ale to distinguish between a fair reference to something and seriously infringing its IP.  Likewise, we could distinguish the aspects of social media that are more like looking at holiday snaps over a coffee, compared to pirate copies for commercial profit.

However, in so many areas it is the other way round, our laws are struggling to restrict the excesses of the internet.

Just a few weeks ago a 14 year old girl was given permission to sue Facebook.  Multiple times over a 2 year period nude pictures of her were posted and reposted.  Facebook hides behind the argument that it is user content, it takes down the images when they are pointed out, and yet a massive technology company, which is able to recognise faces is not able to identify the same photo being repeatedly posted. Back to Mozilla: “anyone, anywhere, can create and reach an audience without anyone standing in the way” – really?

Of course this vision of the internet without boundaries is not just about self expression, but freedom of speech:

“We need to defend the principle of innovation without permission in copyright law. Abandoning it by holding platforms liable for everything that happens online would have an immense chilling effect on speech, and would take away one of the best parts of the internet — the ability to innovate and breathe new meaning into old content.”

Of course, the petition is signalling out EU law, which inconveniently includes various provisions to protect the privacy and rights of individuals, not dictatorships or centrally controlled countries.

So, who benefits from such an open and unlicensed world?  Clearly not the small artist or the victim of cyber-bullying.

Laissez-faire has always been an aim for big business, but without constraint it is the law of the jungle and always ends up benefiting the powerful.

In the 19th century it was child labour in the mills only curtailed after long battles.

In the age of the internet, it is the vast US social media giants who hold sway, and of course the search engines, who just happen to account for $300 million of revenue for Mozilla Foundation annually, 90% of its income.


A tale of two conferences and the future of learning technology in the UK

Over the past few weeks I’ve been to two conferences focused on different aspects of technology and learning, Talis Insight Europe and ACM Learning at Scale (L@S). This led me to reflect on the potential for and barriers to ground breaking research in these areas in the UK.

The first conference, Talis Insight Europe, grew out of the original Talis User Group, but as well as company updates on existing and new products, also has an extensive line-up of keynotes by major educational visionaries and decision makers (including pretty much the complete line-up of JISC senior staff) and end-user contributed presentations.

hole-in-the-wall-Begin02The second, Learning @ Scale, grew out of the MOOC explosion, and deals with the new technology challenges and opportunities when we are dealing with vast numbers of students. It also had an impressive array of keynote speakers, including Sugata Mitra, famous for the ‘Hole in the Wall‘, which brought technology to street children in India.

Although there were some common elements (big data and dashboards got a mention in both!), the audiences were quite different. For Insight, the large majority were from HE (Higher Education) libraries, followed by learning technologists, industry representatives, and HE decision-makers. In contrast, L@S consisted largely of academics, many from computing or technical backgrounds, with some industry researchers, including, as I was attending largely with my Talis hat on, me.

insight-2016-jisc-keynoteIn a joint keynote at Insight, Paul Fieldman and Phil Richards the CEO and CIO of JISC, described the project to provide a learning analytics service [FR16,JI16] (including student app and, of course, dashboard) for UK institutions. As well as the practical benefits, they outlined a vision where the UK leads the way in educational big data for personalised learning.

Given a long track record of education and educational technology research in the UK, the world-leading distance-learning university provision of the Open University, and recent initiatives both those outlined by JISC and FutureLearn (building on the OUs vast experience), this vision seems not unreasonable.

However, on the ground at Learning @ Scale, there was a very different picture; the vast majority of papers and attendees were from the US, an this despite the conference being held in Edinburgh.

To some extent this is as one might expect. While traditional distance learning, including the OU, has class sizes that for those in face-to-face institutions feel massive; these are dwarfed by those for MOOCs, which started in the US; and it is in the US where the main MOOC players (Coursera, udacity, edX) are based. edX alone had initial funding more than ten times that available to FutureLearn, so in sheer investment terms, the balance at L@S is representative.

FutureLearn-logoHowever, Mike Sharples, long-term educational technology researcher and Academic Lead at FutureLearn, was one of the L@S keynotes [Sh16]. In his presentation it was clear that FutureLearn and UK MOOCs punch well above their weight, with retention statistics several times higher than US counterparts. While this may partly be due to topic areas, it is also a reflection of the development strategy. Mike outlined how empirically founded educational theory has driven the design of the FutureLearn platform, not least the importance of social learning. Perhaps then not surprisingly, one of the areas where FutureLearn substantially led over US counterparts was in social aspects of learning.

So there are positive signs for UK research in these areas. While JISC has had its own austerity-driven funding problems, its role as trusted intermediary and active platform creator offers a voice and forum that few, if any, other countries posses. Similarly, while FutureLearn needs to be sustainable, so has to have a certain inward focus, it does seem to offer a wonderful potential resource for collaborative research. Furthermore the open education resource (OER) community seems strong in the UK.

The Teaching Excellence Framework (TEF) [HC16,TH15] will bring its own problems, more about justifying student fee increases than education, potentially damaging education through yet more ill-informed political interference, and re-establishing class-based educational apartheid. However, it will certainly increase universities’ interest in education technology.

Set against this are challenges.

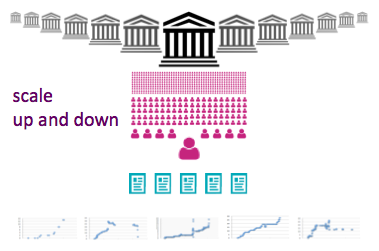
First was the topic of my own L@S work-in-progress paper – Challenge and Potential of Fine Grain, Cross-Institutional Learning Data [Dx16]. At Talis, we manage half a million reading lists, containing over 20 million resources, spread over more than 85 institutions including more than half of UK higher education. However, these institutions are all very different, and the half million courses each only may have only tens or low hundreds of students. That is very large scale in total volume, but highly heterogeneous. The JISC learning analytics repository will have exactly the same issues, and are far more difficult to deal with by machine learning or statistical analysis than the relatively homogeneous data from a single huge MOOC.

scale-up-and-down

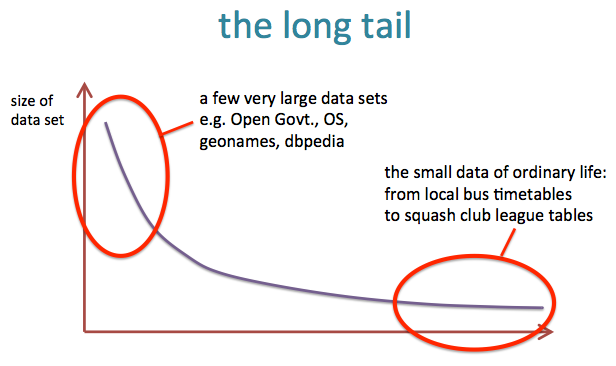
These issues of heterogeneous scale are not unique to education and ones that as a general information systems phenomena, I have been interested in for many years, and call the “long tail of small data” [Dx10,Dx15]. While this kind of data is more complex and difficult to deal with, this is of course a major research challenge, and potentially has greater long-term promise than the study of more homogeneous silos. I am finding this in my own work with musicologist [IC16,DC14], and is emerging as an issue in the natural sciences [Bo13,PC07].

long-tail

Another problem is REF, the UK ‘Research Excellence Framework’. My post-hoc analysis of the REF data revealed the enormous bias in the computing sub-panel against any form of applied and human-oriented work [Dx15b,Dx15c]. Of course, this is not a new issue, just that the available data has made this more obvious and undeniable. This affects my own core research area of human–computer interaction, but also, and probably much more substantially, learning technology research. Indeed, I think most learning technologists had already sussed this out well before REF2014 as there were very few papers submitted in this area to the computing panel. I assume most research on learning technology was submitted to the education panel.

To some extent it does not matter where research is submitted and assessed; however, while in theory the mapping between university departments and submitted units is fluid for REF, in practice submitting to ‘other’ panels is problematic making it difficult to write coherent narratives about the research environment. If learning technology research is not seen as REF-able in computing, computing departments will not recruit in these areas and discourage this kind of research. While my hope is that REF2020 will not re-iterate the mistakes of REF2014, there is no guarantee of this, and anyway the effects on institutional policy will already have been felt.

However, and happily, the kinds of research needed to make sense of this large-scale heterogeneous data may well prove more palatable to a computing REF panel than more traditional small-scale learning technology. It would be wonderful to see research collaborations between those with long-term experience and understanding of educational issues, with hard-core machine learning and statistical analysis – this is BIG DATA and challenging data. Indeed one of the few UK papers at L@S involved Pearson’s London-based data analysis department, and included automatic clustering, hidden Markov models, and regression analysis.

In short, while there are barriers in the UK, there is also great potential for exciting research that is both theoretically challenging and practically useful, bringing the insights available from large-scale educational data to help individual students and academics.

References

[Bo13] Christine L. Borgman. Big data and the long tail: Use and reuse of little data. Oxford eResearch Centre Seminar, 12th March 2013. http://works.bepress.com/borgman/269/

[Dx10] A. Dix (2010). In praise of inconsistency – the long tail of small data. Distinguished Alumnus Seminar, University of York, UK, 26th October 2011.
http://www.hcibook.com/alan/talks/York-Alumnus-2011-inconsistency/

[Dx15] A. Dix (2014/2015). The big story of small data. Talk at Open University, 11th November 2014; Oxford e-Research Centre, 10th July 2015; Mixed Reality Laboratory, Nottingham, 15th December 2015.
http://www.hcibook.com/alan/talks/OU-2014-big-story-small-data/

[DC14] Dix, A., Cowgill, R., Bashford, C., McVeigh, S. and Ridgewell, R. (2014). Authority and Judgement in the Digital Archive. In The 1st International Digital Libraries for Musicology workshop (DLfM 2014), ACM/IEEE Digital Libraries conference 2014, London 12th Sept. 2014. https://alandix.com/academic/papers/DLfM-2014/

[Dx15b] Alan Dix (2015/2016).  REF2014 Citation Analysis. accessed 8/5/2016.  https://alandix.com/ref2014/

[Dx15c] A. Dix (2015). Citations and Sub-Area Bias in the UK Research Assessment Process. In Workshop on Quantifying and Analysing Scholarly Communication on the Web (ASCW’15) at WebSci 2015 on June 30th in Oxford. http://ascw.know-center.tugraz.at/2015/05/26/dix-citations-and-sub-areas-bias-in-the-uk-research-assessment-process/

[Dx16]  Alan Dix (2016). Challenge and Potential of Fine Grain, Cross-Institutional Learning Data. Learning at Scale 2016. ACM. https://alandix.com/academic/papers/LS2016/

[FR16] Paul Feldman and Phil Richards (2016).  JISC – Helping the UK become the most advanced digital teaching and research nation in the world.  Talis Insight Europe 2016. https://talis.com/2016/04/29/jisc-keynote-paul-feldman-phil-richards-talis-insight-europe-2016/

[HC16] The Teaching Excellence Framework: Assessing Quality in Higher Education. House of Commons, Business, Innovation and Skills Committee, Third Report of Session 2015–16. HC 572.  29 February 2016.  http://www.publications.parliament.uk/pa/cm201516/cmselect/cmbis/572/572.pdf

[IC16] In Concert (2014-2016).  accessed 8/5/2016  http://inconcert.datatodata.com

[JI16]  Effective learning analytics. JISC, accessed   8/5/2016.  https://www.jisc.ac.uk/rd/projects/effective-learning-analytics

[PC07] C. L. Palmer, M. H. Cragin, P. B. Heidorn and L.C. Smith. 2007. Data curation for the long tail of science: The Case of environmental sciences. 3rd International Digital Curation Conference, Washington, DC. https://apps.lis.illinois.edu/wiki/ download/attachments/32666/Palmer_DCC2007.pdf

[Sh16]  Mike Sharples (2016).  Effective Pedagogy at Scale, Social Learning and Citizen Inquiry (keynote). Learning at Scale 2016. ACM. http://learningatscale.acm.org/las2016/keynotes/#k2

[TH15] Teaching excellence framework (TEF): everything you need to know.  Times Higher Education, August 4, 2015. https://www.timeshighereducation.com/news/teaching-excellence-framework-tef-everything-you-need-to-know