REF Redux 2 – world ranking of UK computing

This is the second of my posts on the citation-based analysis of REF, the UK research assessment process in computer science. The first post set the scene and explained why citations are a valid means for validating (as opposed generating) research assessment scores.

Spoiler:  for outputs of similar international standing it is ten times harder to get 4* in applied areas than more theoretical areas

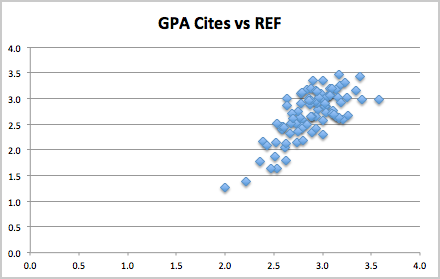
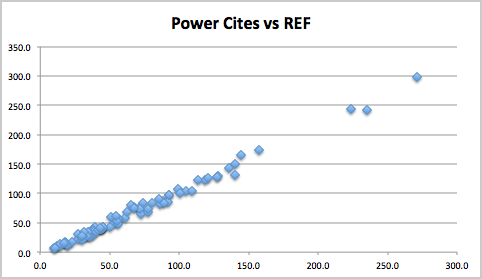
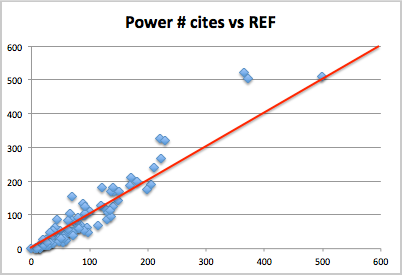
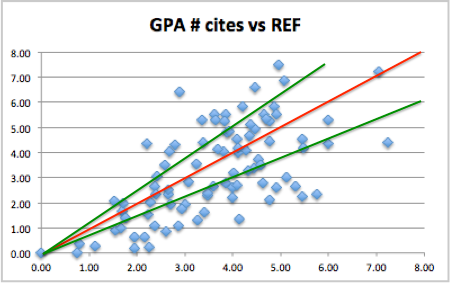
As explained in the previous post amongst the public domain data available is the complete list of all outputs (except a very small number of confidential reports), this does NOT include the actual REF 4*/3*/2*/1* score, but does include Scopus citation data from late 2013 and Google scholar citation data from late 2014.

From this seven variations of citation metrics were used in my comparative analysis, but essentially all give the same results.

For this post I will focus on one of them, which is perhaps the clearest, effectively turning citation data into world ranking data.

As part of the pre-submission materials, the REF team distributed a spreadsheet, prepared by Scopus, which lists for different subject areas the number of citations for the best 1%, 5%, 10% and 25% of papers in each area. These vary between areas, in particular more theoretical areas tend to have more Scopus counted citations than more applied areas. The spreadsheet allows one to normalise the citation data and for each output see whether it is in the top 1%, 5%, 10% or 25% of papers within its own area.

The overall figure across REF outputs in computing is as follows:

Top 1%      16.9%
Top 1-5%:   27.9%
Top 6-10%:  18.0%
Top 11-25%: 23.8%
Lower 75%:  13.4%

The first thing to note is that about 1 in 6 of the submitted outputs are in the top 1% worldwide and not far short of a half (45%) in the top 5%.   Of course this is the top publications, so one would expect the REF submissions to score well, but still this feels like a strong indication of the quality of UK research in computer science and informatics.

According to the REF2014 Assessment criteria and level definitions, the definition of 4* is “quality that is world-leading in terms of originality, significance and rigour“, and so these world citation rankings correspond very closely to “world leading”. In computing we allocated 22% of papers as 4*, that is, roughly, if a paper is in the top 1.5% of papers world wide in its area it is ‘world leading’, which sounds reasonable.

The next level 3* “internationally excellent” covers a further 47% of outputs, so approximately top 11% of papers world wide, which again sounds a reasonable definition of “internationally excellent”. Validating the overall quality criteria of the panel.

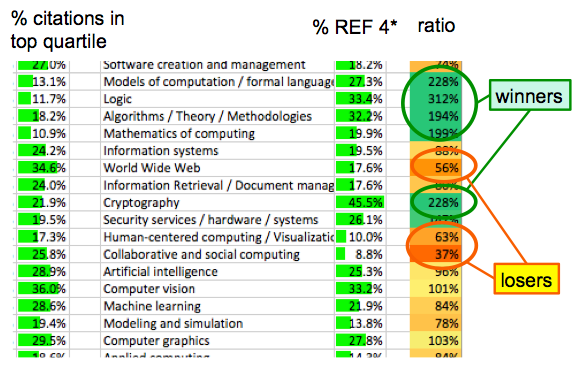
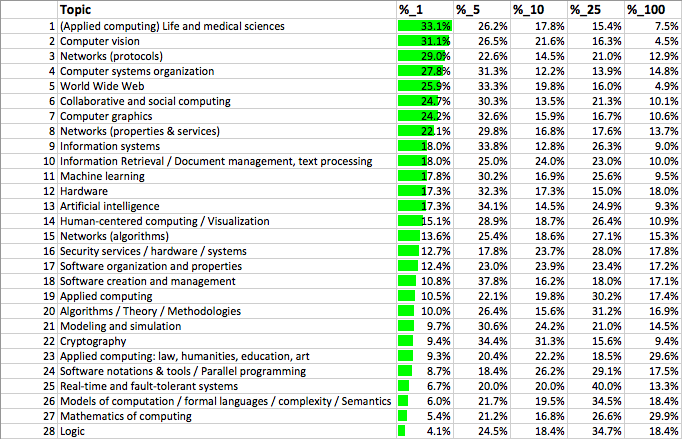
As the outputs include a sub-area tag, we can create similar world ‘league tables’ for each sub-area of computing, that is ranking the REF submitted outputs in each area amongst their own area worldwide:

Cite-ranks

As is evident there is a lot of variation, with some top areas (applications in life sciences and computer vision) with nearly a third of outputs in the top 1% worldwide, whilst other areas trail (mathematics of computing and logic), with only around 1 in 20 papers in top 1%.

Human computer interaction (my area) is split between two headings “human-centered computing” and “collaborative and social computing” between them just above mid point; AI also in the middle and Web in top half of the table.

Just as with the REF profile data, this table should be read with circumspection – it is about the health of the sub-area overall in the UK, not about a particular individual or group which may be at the stronger or weaker end.

The long-tail argument (that weaker researchers and those in less research intensive institutions are more likely to choose applied and human-centric areas) of course does not apply to logic, mathematics and formal methods at the bottom of the table. However, these areas may be affected by a dilution effect as more discursive areas are perhaps less likely to be adopted by non-first-language English academics.

This said, the definition of 4* is “Quality that is world-leading in terms of originality, significance and rigour“, and so these world rankings seem as close as possible to an objective assessment of this.

It would therefore be reasonable to assume that this table would correlate closely to the actual REF outputs, but in fact this is far from the case.

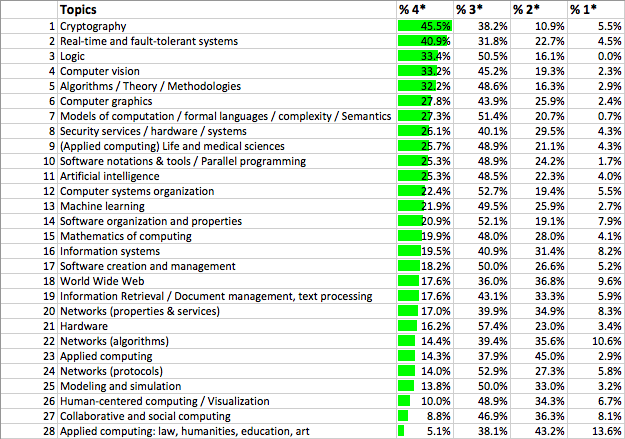
Compare this to the REF sub-area profiles in the previous post:

REF-ranks

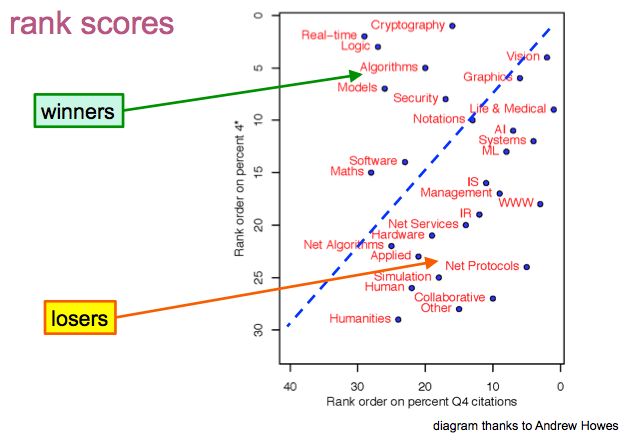
Some areas lie at similar points in both tables; for example, computer vision is near the top of both tables (ranks 2 and 4) and AI a bit above the middle in both (ranks 13 and 11). However, some areas that are near the middle in terms of world rankings (e.g. human-centred computing (rank 14) and even some near the top (e.g. network protocols at rank 3) come out very poorly in REF (ranks 26 and 24 respectively). On the other hand, some areas that rank very low in the world league table come very high in REF (e.g. logic rank 28 in ‘league table’ compared to rank 3 in REF).

On the whole, areas that are more applied or human focused tend to do a lot worse under REF than they appear to be when looked in terms of their world rankings, whereas more theoretical areas seem to have inflated REF rankings. Those that are traditional algorithmic computer science’ (e.g. vision, AI) are ranked similarly in REF and in the world rankings.

We will see other ways of looking at these differences in the next post, but one way to get a measure of the apparent bias is by looking at how high an output needs to be in world rankings to get a 4* depending on what area you are in.

We saw that on average, over all of computing, outputs that rank in the top 1.5% world-wide were getting 4* (world leading quality).

For some areas, for example, AI, this is precisely what we see, but for others the picture is very different.

In applied areas (e.g. web, HCI), an output needs to be in approximately the top 0.5% of papers worldwide to get a 4*, whereas in more theoretical areas (e.g. logic, formal, mathematics), a paper needs to only be in the top 5%.

That is looking at outputs equivalent in ‘world leading’-ness (which REF is trying to measure), it is 10 times easier to get a 4* in theoretical areas than applied ones.

REF Redux 1 – UK research assessment for computing; what it means and is it right?

REF is the 5 yearly exercise to assess the quality of UK university research, the results of which are crucial for both funding and prestige. In 2014, I served on the sub-panel that assessed computing submissions. Since, the publication of the results I have been using public domain data from the REF process in order to validate the results using citation data.

The results have been alarming suggesting that, despite the panel’s best efforts to be fair, in fact there was significant bias both in terms of areas of computer science and types of universities.  Furthermore the first of these is also likely to have led to unintentional emergent gender bias.

I’ve presented results of this at a bibliometrics workshop at WebSci 2015 and at a panel at the British HCI conference a couple of weeks ago. However, I am aware that the full data and spreadsheets can be hard to read, so in a couple of posts I’ll try to bring out the main issues. A report and mini-site describes the methods used in detail, so in these posts I will concentrate on the results, and implications, starting in this post by setting the scene seeing how REF ranked sub-areas of computing and the use of citations for validation of the process. The next post will look at how UK computing sits amongst world research, and whether this agrees with the REF assessment.

Few in UK computing departments will have not seen the ranking list produced as part of the final report of the computing REF panel.

REF-ranks

Here topic areas are ranked by the percentage of 4* outputs (the highest rank). Top of the list is Cryptography, with over 45% of outputs ranked 4*. The top of the list is dominated by theoretical computing areas, with 30-40% 4*, whilst the more applied and human areas are at the lower end with less than 20% 4*. Human-centred computing and collaborative computing, the areas where most HCI papers would be placed, are pretty much at the bottom of the list, with 10% and 8.8% of 4* papers respectively.

Even before this list was formally published I had a phone call from someone in an institution where the knowledge of it had obviously leaked. Their department was interviewing for a lectureship and the question being asked was whether they should be recruiting candidates from HCI as this will clearly not be good looking towards REF 2020.

Since then I have heard of numerous institutions who are questioning the value of supporting these more applied areas, due to their apparent poor showing under REF.

In fact, even taken at face value, the data says nothing at all about the value in particular departments., and the sub-panel report includes the warning “These data should be treated with circumspection“.

There are three possible reasons any, or all of which would give rise to the data:

  1. the best applied work is weak — including HCI :-/
  2. long tail — weak researchers choose applied areas
  3. latent bias — despite panel’s efforts to be fair

I realised that citation data could help disentangle these.

There has been understandable resistance against using metrics as part of research assessment. However, that is about their use to assess individuals or small groups. There is general agreement that citation-based metrics are a good measure of research quality en masse; indeed I believe HEFCE are using citations to verify between-panel differences in 4* allocations, and in Morris Sloman’s post REF analysis slides (where the table above first appeared), he also uses the overall correlation between citations and REF scores as a positive validation of the process.

The public domain REF data does not include the actual scores given to each output, but does include citations data provided by Scopus in 2013. In addition, for Morris’ analysis in late 2014, Richard Mortier (then at Nottingham, now at Cambridge) collected Google Scholar citations for all REF outputs.

Together, these allow detailed citation-based analysis to verify (or otherwise) the validity of the REF outputs for computer science.

I’ll go into details in following posts, but suffice to say the results were alarming and show that, whatever other effects may have played a part, and despite the very best efforts of all involved, very large latent bias clearly emerged during the progress.

WebSci 2015 – WebSci and IoT panel

Sunshine on Keble quad, brings back memories of undergraduate days at Trinity, looking out toward the Wren Library.

Yesterday was first day of WebSci 2015.  I’m here largely as I’m giving my work on comparing REF outcomes with citation measures, “Citations and Sub-Area Bias in the UK Research Assessment Process”, at the workshop on “Quantifying and Analysing Scholarly Communication on the Web” on Tuesday.

However, yesterday I was also on a panel on “Web Science & the Internet of Things”.

These are some of the points I made in my initial positioning remarks.  I talked partly about a few things sorting round the edge of Internet of Things (IoT) and then some concerts examples of IoT related rings I;ve been involved with personally and use these to mention  few themes that emerge.

Not quite IoT

Talis

Many at WebSci will remember Talis from its SemWeb work.  The SemWeb side of the business has now closed, but the education side, particularly Reading List software with relationships between who read what and how they are related definitely still clear WebSci.  However, the URIs (still RDF) of reading items are often books, items in libraries each marked with bar codes.

Years ago I wrote about barcodes as one of the earliest and most pervasive CSCW technologies (“CSCW — a framework“), the same could be said for IoT.  It is interesting to look at the continuities and discontinuities between current IoT and these older computer-connected things.

The Walk

In 2013 I walked all around Wales, over 1000 miles.  I would *love* to talk about the IoT aspects of this, especially as I was wired up with biosensors the whole way.  I would love to do this, but can’t , because the idea of the Internet in West Wales and many rural areas is a bad joke.  I could not even Tweet.  When we talk about the IoT currently, and indeed anything with ‘Web’ or ‘Internet’ in its name, we have just excluded a substantial part of the UK population, let alone the world.

REF

Last year I was on the UK REF Computer Science and Informatics Sub-Panel.  This is part of the UK process for assessing university research.  According to the results it appears that web research in the UK is pretty poor.   In the case of the computing sub-panel, the final result was the outcome of a mixed human and automated process, certainly interesting HCI case study of socio-technical systems and not far from WeSci concerns.

This has very real effects on departmental funding and on hiring and investment decisions within universities. From the first printed cheque, computer systems have affected the real world, while there are differences in granularity and scale, some aspects of IoT are not new.

Later in the conference I will talk about citation-based analysis of the results, so you can see if web science really is weak science 😉

Clearly IoT

Three concrete IoT things I’ve been involved with:

Firefly

While at Lancaster Jo Finney and I developed tiny intelligent lights. After more than ten years these are coming into commercial production.

Imagine a Christmas tree, and put a computer behind each and every light – that is Firefly.  Each light becomes a single-pixel network computer, which seems like technological overkill, but because the digital technology is commoditised, suddenly the physical structures of wires and switches is simplified – saving money and time and allowing flexible and integrated lighting.

Even early prototypes had thousands of computers in a few square metres.  Crucially too the higher level networking is all IP.  This is solid IoT territory.  However, like a lot of smart-dust, and sensing technology based around homogeneous devices and still, despite computational autonomy, largely centrally controlled.

While it may be another 10 years before it makes the transition from large-scale display lighting to domestic scale; we always imagined domestic scenarios.  Picture the road, each house with a Christmas tree in its window, all Firefly and all connected to the internet, light patterns more form house to hose in waves, coordinate twinkling from window to window glistening in the snow.  Even in tis technology issues of social interaction and trust begin to emerge.

FitBit

My wife has a FitBit.  Clearly both and IoT technology and WebSci phenomena with millions of people connecting their devices into FitBit’s data sharing and social connection platform.

The week before WebSci we were on holiday, and we were struggling to get her iPad’s mobile data working.  The Vodafone website is designed around phones, and still (how many iPads!) misses crucial information essential for data-only devices.

The FitBit’s alarm had been set for an early hour to wake us ready to catch the ferry.  However, while the FitBit app on the iPad and the FitBit talk to one another via Bluetooth, the app will not control the alarm unless it is Internet connected.  For the first few mornings of our holiday at 6am each morning …

Like my experience on the Wales walk the software assumes constant access to the web and fails when this is not present.

Tiree Tech Wave

I run a twice a year making, talking and thinking event, Tiree Tech Wave, on the Isle of Tiree.  A wide range of things happen, but some are connected with the island itself and a number of island/rural based projects have emerged.

One of these projects, OnSupply looked at awareness of renewable power as the island has a community wind turbine, Tilly, and the emergence of SmartGrid technology.  A large proportion of the houses on the island are not on modern SmartGrid technology, but do have storage heating controlled remotely, for power demand balancing.  However, this is controlled using radio signals, and switched as large areas.  So at 4am each morning all the storage heating goes on and there is a peak.  When, as happens occasionally, there are problems with the cable between the island and the mainland, the Island’s backup generator has to deal with this surge, it cannot be controlled locally.  Again issuss of connectivity deeply embedded in the system design.

We also have a small but growing infrastructure of displays and sensing.

We have, I believe, the worlds first internet-enabled shop open sign.  When the café is open, the sign is on, this is broadcast to a web service, which can then be displayed in various ways.  It is very important in a rural area to know what is open, as you might have to drive many miles to get to a café or shop.

We also use various data feeds from the ferry company, weather station, etc., to feed into public and web displays (e.g. TireeDashboard).  That is we have heterogeneous networks of devices and displays communicating through web apis and services – good Iot and WebSCi!

This is part of a broader vision of Open Data Islands and Communities, exploring how open data can be of value to small communities.  On their own open environments tend to be most easily used by the knowledgeable, wealthy and powerful, reinforcing rather than challenging existing power structures.  We have to work explicitly to create structures and methods that make both IoT and the potential of the web truly of benefit to all.


Into the heart of darkness

Life is not all joy and fun, but often dark, depressing and painful.

Easter and Christmas are part of popular culture: Easter bunnies, Easter eggs, Christmas presents and Santa Claus. However, except for the odd Hot Cross Bun, Good Friday slips under the radar. The birth of a child and the glory of renewed life are images that are obvious causes for celebration, but a tale of abandonment followed by painful and bloody execution maybe has Gothic overtones, but is hardly party-worthy.

And yet, for those of different and no faith as well as for Christians, Good Friday touches issues of mythic as well as deeply personal significance.

Sometimes we simply need someone to share the darkness with us.

In days past the season of Lent with its fasting and sobriety helped build a sombre tension. Reading the Gospel accounts of Easter week is like one of those disaster films, where life appears to go on as normal, but with small and growing signs of the catastrophe to come. While we also know of the Easter story that follows, this does not shield us from the deep pit of despair that precedes it, “My God, My God, why have you forsaken me1.

I love Nina Bawden‘s books for children, and often in them are very real and flawed characters who, while young, can sometimes cause real pain and harm; they dig at one’s own buried memories and knowledge of our own flaws.

The Easter story is full of such characters, Peter falling asleep as Jesus prayed in Gethsemane, just at the point he was needed most as a friend; and later, after Jesus was arrested, in fear for his own life, denying that he ever knew Jesus. Each time I read it part of me wants to shout at him, warn him, encourage him, knowing that in his position I would do the same.

And Judas, the friend turned betrayer. Just like the actions of Lubitiz, who crashed the plane in the alps, many have speculated on the reasons in Judas’ heart: disillusionment that Jesus was not going to oust the Romans, greed for the bribe of silver, self-destruction, or maybe simply that bitter rancour in the presence of someone better than ourselves.

The 1960s protest song “There but for fortune” talks of the prisoner, the hobo, the drunk and the war-torn, but now I often think of the Auschwitz guard, the Rwandan militia, the ISIS terrorist — what are the life chances and life choices that brought me to where I am compared to those that took them?

Reading of Judas his betrayal, his remorse, throwing the tainted money back at the Priests’ feet, and taking his own life — there but for fortune.

And it is no accident that the blood money, the price of a life, the price of Jesus’ life, was used to buy a burial ground for strangers and foreigners2. The death of one who sought out the marginal, the poor, the disabled, and the ‘immoral’ buys a resting place for the same.

Jesus death on the cross is, of course, at the heart of Christian theology, Paul once wrote to early converts on Corinth, “I resolved to know nothing while I was with you except Jesus Christ and him crucified.”3. The main focus is often on sacrifice, both personal, “greater love has no man than he lay down his life for his friends4, and also theological, cosmic atonement for sins.

However, as well as this message that Jesus died for us, there is also a parallel message, that Jesus died with us, alongside us in the darkest hour. This is the end point of the Christmas story, one who was “like us in every respect5, entering the world, a tiny head crowned in the blood of childbirth, and leaving crowned by bloody thorns.

While the early Church was never at doubt as to the resurrection of Jesus, the completeness of this moment, Jesus dying, flanked by criminals and a weeping prostitute at his feet, is so intense that the earliest versions of Mark’s gospel rush through the Easter morning itself in a mere 8 verses, and end with the empty tomb, the astonished disciples and the words, “for they were afraid6.

The Apostles’ Creed repeated in various forms across all Western churches says Jesus “was crucified, died and was buried; he descended into hell“. Hell is not an easy concept for the modern mind, filled with images of half-comic horned demons. But despite its B-movie connotations, and irrespective of whether you read it literally, figuratively or mythically, Hades, Gehenna, the pit are powerful images.

Hell of 1st century Palestine is not just for the lifeless shades of Greek Hades, but more like Tartarus, the place of damnation, the abode of the sinner. Peter says that Jesus “preached to the dead7, and other authors simply that death could not ultimately hold him8, but all agree that for three days that was where Jesus was, not simply dying for and with us, but entering the very place of the Auschwitz guard, of Judas, of the ISIS killer, of our own deepest darkness, and sharing it.

The one of whom they said, “Here is a glutton and a drunkard, a friend of tax collectors and sinners9, the one who spent his life with outcasts and prostitutes, would he be anywhere else?


  1. Matthew 27:46[back]
  2. Matthew 27:3-8[back]
  3. 1 Corinthians 2:2[back]
  4. John 15:13[back]
  5. Hebrews 2:17[back]
  6. Mark 6:8[back]
  7. 1 Peter 4:6[back]
  8. Acts 2:24[back]
  9. Matthew 11:19[back]

If the light is on, they can hear (and now see) you

hello-barbie-matel-from-guardianFollowing Samsung’s warning that its television sets can listen into your conversations1, and Barbie’s, even more scary, doll that listens to children in their homes and broadcasts this to the internet2, the latest ‘advances’ make it possible to be seen even when the curtains are closed and you thought you were private.

For many years it has been possible for security services, or for that matter sophisticated industrial espionage, to pick up sounds based on incandescent light bulbs.

The technology itself is not that complicated, vibrations in the room are transmitted to the filament, which minutely changes its electrical characteristics. The only complication is extracting the high-frequency signal from the power line.

040426-N-7949W-007However, this is a fairly normal challenge for high-end listening devices. Years ago when I was working with submarine designers at Slingsby, we were using the magnetic signature of power running through undersea cables to detect where they were for repair. The magnetic signatures were up to 10,000 times weaker than the ‘noise’ from the Earth’s own magnetic field, but we were able to detect the cables with pin-point accuracy3. Military technology for this is far more advanced.

The main problem is the raw computational power needed to process the mass of data coming from even a single lightbulb, but that has never been a barrier for GCHQ or the NSA, and indeed, with cheap RaspberryPi-based super-computers, now not far from the hobbyist’s budget4.

Using the fact that each lightbulb reacts slightly differently to sound, means that it is, in principle, possible to not only listen into conversations, but work out which house and room they come from by simply adding listening equipment at a neighbourhood sub-station.

The benefits of this to security services are obvious. Whereas planting bugs involves access to a building, and all other techniques involve at least some level of targeting, lightbulb-based monitoring could simply be installed, for example, in a neighbourhood known for extremist views and programmed to listen for key words such as ‘explosive’.

For a while, it seemed that the increasing popularity of LED lightbulbs might end this. This is not because LEDs do not have an electrical response to vibrations, but because of the 12V step down transformers between the light and the mains.

Of course, there are plenty of other ways to listen into someone in their home, from obvious bugs to laser-beams bounced of glass (you can even get plans to build one of your own at Instructables), or even, as MIT researchers recently demonstrated at SIGGRAPH, picking up the images of vibrations on video of a glass of water, a crisp packet, and even the leaves of a potted plant5. However, these are all much more active and involve having an explicit suspect.

Similarly blanket internet and telephone monitoring have applications, as was used for a period to track Osama bin Laden’s movements6, but net-savvy terrorists and criminals are able to use encryption or bypass the net entirely by exchanging USB sticks.

However, while the transformer attenuates the acoustic back-signal from LEDs, this only takes more sensitive listening equipment and more computation, a lot easier than a vibrating pot-plant on video!

So you might just think to turn up the radio, or talk in a whisper. Of course, as you’ve guessed by now, and, as with all these surveillance techniques, simply yet more computation.

Once the barriers of LEDs are overcome, they hold another surprise. Every LED not only emits light, but acts as a tiny, albeit inefficient, light detector (there’s even an Arduino project to use this principle).   The output of this is a small change in DC current, which is hard to localise, but ambient sound vibrations act as a modulator, allowing, again in principle, both remote detection and localisation of light.

220px-60_LED_3W_Spot_Light_eq_25WIf you have several LEDs, they can be used to make a rudimentary camera7. Each LED lightbulb uses a small array of LEDs to create a bright enough light. So, this effectively becomes a very-low-resolution video camera, a bit like a fly’s compound eye.

While each image is of very low quality, any movement, either of the light itself (hanging pendant lights are especially good), or of objects in the room, can improve the image. This is rather like the principle we used in FireFly display8, where text mapped onto a very low-resolution LED pixel display is unreadable when stationary, but absolutely clear when moving.

pix-11  pix-21
pix-12  pix-22
LEDs produce multiple very-low-resolution image views due to small vibrations and movement9.

OLYMPUS DIGITAL CAMERA  OLYMPUS DIGITAL CAMERA
Sufficient images and processing can recover an image.

So far MI5 has not commented on whether it uses, or plans to use this technology itself, nor whether it has benefited from information gathered using it by other agencies. Of course its usual response is to ‘neither confirm nor deny’ such things, so without another Edward Snowden, we will probably never know.

So, next time you sit with a coffee in your living room, be careful what you do, the light is watching you.

  1. Not in front of the telly: Warning over ‘listening’ TV. BBC News, 9 Feb 2015. http://www.bbc.co.uk/news/technology-31296188[back]
  2. Privacy fears over ‘smart’ Barbie that can listen to your kids. Samuel Gibbs, The Guardian, 13 March 2015. http://www.theguardian.com/technology/2015/mar/13/smart-barbie-that-can-listen-to-your-kids-privacy-fears-mattel[back]
  3. “Three DSP tricks”, Alan Dix, 1998. https://alandix.com/academic/papers/DSP99/DSP99-full.html[back]
  4. “Raspberry Pi at Southampton: Steps to make a Raspberry Pi Supercomputer”, http://www.southampton.ac.uk/~sjc/raspberrypi/[back]
  5. A. Davis, M. Rubinstein, N. Wadhwa, G. Mysore, F. Durand and W. Freeman (2014). The Visual Microphone: Passive Recovery of Sound from Video. ACM Transactions on Graphics (Proc. SIGGRAPH), 33(4):79:1–79:10 http://people.csail.mit.edu/mrub/VisualMic/[back]
  6. Tracking Use of Bin Laden’s Satellite Phone, all Street Journal, Evan Perez, Wall Street Journal, 28th May, 2008. http://blogs.wsj.com/washwire/2008/05/28/tracking-use-of-bin-ladens-satellite-phone/[back]
  7. Blinkenlight, LED Camera. http://blog.blinkenlight.net/experiments/measurements/led-camera/[back]
  8. Angie Chandler, Joe Finney, Carl Lewis, and Alan Dix. 2009. Toward emergent technology for blended public displays. In Proceedings of the 11th international conference on Ubiquitous computing (UbiComp ’09). ACM, New York, NY, USA, 101-104. DOI=10.1145/1620545.1620562[back]
  9. Note using simulated images; getting some real ones may be my next Tiree Tech Wave project.[back]

Statistics and individuals

Ramesh Ramloll recently posted on Facebook about two apparently contradictory news reports on vitamin D, one entitled “Recommendation for vitamin D intake was miscalculated, is far too low, experts say” and the other  “High levels of vitamin D is suspected of increasing mortality rates“.

While specifically about diet and vitamin D intake, there seems to be a number of lessons from this: about communication of science (Ramesh’s original reason for posting this), widespread statistical ignorance amongst scientists (amongst others), and the fact that individuals are not averages.

Ramesh remarked:

Science reporting is broken, or science itself is broken … the masses are like deer in headlights when contradictory recommendations through titles like these appear in the mass media, one week or so apart.

I know that rickets is currently on the increase in the UK, due partly to poverty and poor diets leading to low dietary vitamin D intake, and due partly to fear of harmful UV and skin cancer leading to under-exposure of the skin to sunlight, our natural means of vitamin D production.  So these issues are very important, and as Ramesh points out, clarity in reporting is crucial.

Looking at the two articles, the ‘too low’ article came from North America, the ‘too much’ article, although reported in AAAS ‘EurekaAlert!’ news, originated in University of Copenhagen, so I thought that maybe the difference is that health conscious Danes are simply overdosing.

However, even as a scientist, making sense of the reports is complicated by the fact that they talk in different units.  The ‘too low’ one is about dietary intake of vitamin D measured in ‘IU/day’, and the Danish ‘too much’ report discusses blood levels in ‘nanomol per litre’.  Wow that makes things easy!

Furthermore the Danish study (based on 247,574 Danes, real public health ‘big data’) showed the difference between ‘too much’ and ‘too little’, was a factor of two, 50 vs 100 nanomol/litre.  It suggests, Goldilocks fashion, that 70 nanomol/liter is ‘just right’.  Note however, the ‘EurekaAlert!’ news article does NOT quantify the relative risks of over and under dosing, which does make a big difference to the way they should be read as practical advice, and does not give a link to the source article to find out (this is the AAAS!).

Digging a little deeper into the “too low” news report, it is based on an academic article in the journal ‘Nutrients’,A Statistical Error in the Estimation of the Recommended Dietary Allowance for Vitamin D“, which is re-assessing the amount of dietary vitamin D to achieve the same 50 nanomol/litre level used as the ‘low’ level by the Danish researchers.  The Nutrients article is based not on a new study, but a re-examination of the original meta-study that gave rise to the (US and Canadian) Institute of Medicines current recommendations.   The new article points out that the original analysis confused study averages and individual levels, a pretty basic statistical mistake.

nutrients-06-04472-g001-1024  nutrients-06-04472-g002-1024

 Graphs from “A Statistical Error in the Estimation of the Recommended Dietary Allowance for Vitamin D“. LHS is study averages, RHS taking not account variation within studies.

A few things I took from this:

1)  The level of statistical ignorance amongst those making major decisions (in this case at the Institute of Medicine) is frightening. This is part of a wider issue of innumeracy, which I’ve seen in business/economic news reporting on the BBC, reporting of opinion polls in the Times, academic publishing and reviewing in HCI, and the list goes on.  This is an issue that has worried me for some time (see “Cult of Ignorance“, “Basic Numeracy“).

2) Just how spread the data is for the studies. I guess this is because individual differences and random environmental factors are so great.  This really brings home the importance of replication, which is so hard to get funded or published in many areas of academia, not least in HCI where individual differences and variations within studies are also very high.  But it also emphasises the importance of making sure data is published in such a way that meta-analysis to compare and combine individual studies is possible.

3) Individual difference are large.  Based on the revised suggested limits for dietary vitamin D, designed to bring at least 39/40 people over the recommended blood lower limit of 50 nanomol/litre, half of people would end up with blood levels higher than four or five times that lower limit, that is more than twice as high as the level the other study says leads to deleterious over-consumption levels.  This really brings home that diet and metabolism vary such a lot between people and we need to start to understand individual variations for health advice, not simply averages.  This is difficult, as illustrated by the spread of studies in the ‘too low’ article, but may become possible as more mass data, as used by the Danish study, becomes available.

In short:

individuals matter in statistics

and

statistics matter for individuals


It started with a run … from a conversation at Tiree Tech Wave to an award-winning project

Spring has definitely come to Tiree and in the sunshine I took my second run of the year. On Soroby beach I met someone else out running and we chatted as we ran. It reminded me of another run two years ago …

It was spring of 2013 and a busy Tiree Tech Wave with the launch of Frasan on the Saturday evening. A group had come from the Catalyst project in Lancaster, including Maria Ferrario and she had mentioned running when she arrived, so I said I’d do a run with her. Only later did I discover that her level of running was somewhat daunting, competing in marathons with times that made me wonder if I’d survive the outing.

Happily, Maria modified her pace to reflect my abilities, and we took a short run from the Rural Centre to Chocolates and Charms (good to have a destination), indirectly via Soroby Beach, where I ran today.

Running across the sand we talked about smart grids, and the need to synchronise energy use with renewable supply, and from the conversation the seeds of an idea grew.

fiona-crossapol-beach-2663997355_ea73a75f4c_z-cropped

I started my walk round Wales almost immediately after (with the small matter of my daughter’s wedding in between), but Maria went back to Lancaster and talked to Adrian Friday, who put together a project proposal (with the occasional, very slow email interchange when I could get Internet connections). Towards the end of the summer we heard we had been short-listed and I joined Adrian via Skype for an interview in July.

… and we were successful 🙂

The OnSupply project was born.

OnSupply was a sub-project of the Lancaster Catalyst project. The wider Catalyst project’s aims were to understand better the processes by which advanced technology could be used by communities. OnSupply was the main activity for nine-months of the last year of Catalyst.

OnSupply itself was focused on how people can better understand the availability of renewable energy. Our current model of energy production assumes electricity is always available ‘on demand’ and the power generation companies’ job is to provide it when wanted. However, renewable energy does not come when we want it, but when the wind blows, the tides run and the sun shines. That is in the future we need to shift to a model where energy is used when it is available, ‘on supply’ rather than ‘on demand’.

The Lancaster team, led by Adrian consisted of four full time researchers, Will, Steve, Peter, and of course, Maria, and the other project partners were Tiree Tech Wave, the Tiree Development Trust, Goldsmiths University, and Rory Gianni, an independent developer based in Scotland specialising in environmental issues.

The choice of Tiree was of course partly because of Tiree Tech Wave and my presence here, but also because of Tilly, the Tiree community wind turbine, and the slightly parlous state of the electricity cable between Tiree and the mainland. In many ways the island is just like being on the mainland, you flick the switch and electricity is there. While Tilly can provide nearly a megawatt at full capacity, this simply feeds into the grid, just like the wind farms you see over many hillsides.

However, there is also an extent to which we, as an island population, are more sensitised to issues of electricity and renewable energy.

TTW6_DanPictsForSaturdayPitch-3-604x270

First is the presence of Tilly, which can be seen from much of the island; while the power goes into the grid, when she turns this generates income, which funds various island projects and groups.

But, the same wind that drives Tilly (incidentally the most productive land-based turbine in the UK), shakes power lines, and at its wildest causes shorts and breakages. The fragile power reduces the lifetime of the sophisticated wireless routers, which provide broadband to half the island, and damages fridge compressors.

Furthermore, the aging sea-cable (now happily replaced) frequently broke so that island power was provided for months at a time from backup diesel generator. As well as filling the ferry with oil tankers, the generator cannot cope with the fluctuating power from Tilly, and so for months she is braked, meaning no electricity and so no money.

So, in some ways, a community perfect for investigating issues of awareness of energy production, sensitised enough that it will be easier to see impact, but similar enough to those on the mainland that lessons learnt can be transferred.

wirlygigThe project itself proceeded through a number of workshops and iterative stages, with prototypes designed to provoke discussions and engagement. My favourites were machines that delivered brightly coloured ping-pong balls as part of a game to explore energy uses, and wonderful self-assembly kits for the children, incorporating a wind and solar energy gauge.

The project culminated in a display at the Tiree Agricultural Show.

While OnSupply finished last summer, the reporting continues and a few weeks ago a paper about the project, to be presented at the CHI’2015 conference in South Korea in April, was given a best paper award at the CHI’2015 conference.

… and all this from a run on the beach.


toys for Tech Wave – MicroView

I’m always on the lookout for interesting things to add to the Tiree Tech Wave boxes to join Arduinos, Pis, conductive fabric, Lilypad, Lego Technic, etc., and I had  chance to play with a new bit of kit at Christmas ready for the next TTW in March.

Last year I saw a Kickstarter campaign for MicroView by GeekAmmo, tiny ‘chip-sized’ Arduinos with a built in OLED display.  So I ordered a ‘Learning Kit’ for Tiree Tech Wave, which includes two MicroViews and various components for starter projects.

Initially, the MicroView was ahead of schedule and I hoped they would arrive in time for TTW 8 last October, but they hit a snag in the summer.  The MicroViews are manufactured by Sparkfun who are very experienced in the maker space, but the production volume was larger than they were previously used to and a fault (missing boot loader) was missed by the test regime, leading to several thousands of faulty units being delivered.

Things go wrong and it was impressive to see the way both GeekAmmo and Sparkfun responded to the fault, analysed their quality processes and, particularly important, keeping everyone informed.

So, no MicroViews for TTW8, but they arrived before Christmas, and so one afternoon over Christmas I had a play 🙂

DSC09196 DSC09200

When you power up the MicroView (I used a USB from the computer as power source, but it can be battery powered also) the OLED screen first of all shows a welcome and then takes you through a mini tutorial, connecting up jumpers on the breadboard, and culminating with a flashing LED.  It is amazing that you can do a full tutorial, even a starter one, on a 64×48 OLED!

Although it is possible to program the MicroView from a download IDE, the online tutorials suggest using codebender.cc, which allows you to program the Micriview ‘from the cloud’ and share code (sketches).

The results of my first effort are on the left above 🙂

Can you think of any projects for two tiny Ardunos?  Come to Tiree Tech Wave in March and have a go!

codebender-code


lies, damned lies, and the BBC

I have become increasingly annoyed and distressed over the years at the way the media decides a narrative for various news stories and then selectively presents the facts to tell the story, ignoring or suppressing anything that suggests a more nuanced or less one-sided account.

BBC-news-headline-13-Feb-2015-croppedSometimes I agree with the overall narrative, sometimes I don’t.  Either way the B-movie Western accounts, which cannot recognise that the baddies can sometimes do good and the goodies may not be pristine, both distort the public’s view of the world and perhaps more damagingly weaken the critical eye that is so essential for democracy.

For the newspapers, we know that they have an editorial stance and I expect a different view of David Cameron’s welfare policy in The Guardian compared with The Telegraph. Indeed, I often prefer to read a newspaper I disagree with as it is easier to see the distortions when they clash with one’s own preconceptions.  One of the joys of the British broadsheet press is that whatever the persuasion, the underlying facts are usually there, albeit deeply buried towards the end of a long article.

However, maybe unfairly, I have higher expectations of the BBC, which are sadly and persistently dashed.  Here it seems not so much explicit editorial policy (although one hears that they do get leant upon by government occasionally), more that they believe a simplistic narrative is more acceptable to the viewer … and maybe they just begin to believe there own stories.

A typical (in the sense of terrifyingly bad) example of this appeared this morning.

After the wonderful news of a peace agreement in Ukraine yesterday, this morning the report read:

Ukraine crisis: Shelling follows Minsk peace summit

The ceasefire is due to start on Sunday, so one can only hope this is a last violent outburst, although to what avail as the borders are already set by the Minsk agreement.

The first few lines of the article read as follows:

New shelling has been reported in the rebel-held east Ukrainian cities of Donetsk and Luhansk, a day after a peace deal was reached in Minsk.

There are no confirmed reports of casualties. Both cities are near the front line where the pro-Russian rebels face government forces.

The ceasefire agreed in the Belarusian capital is to begin in eastern Ukraine after midnight (22:00 GMT) on Saturday.

The EU has warned Russia of additional sanctions if the deal is not respected.

If you have kept abreast of the ongoing crisis in Ukraine and can remember your geography, then you will know that this means the Ukrainian Army was shelling rebel-held cities.  However, if you are less aware, this is not the immediate impression of the article.

First notice the passive wording of the title.  Imagine if this had been Syria, the headline would have surely been “Assad’s forces bombard Syrian cities” or “Syrian Army shell civilian areas“.  While the BBC may want to avoid flamboyant titles (although do not demure elsewhere) the article itself is no better.

The opening paragraphs mention ‘shelling’, ‘rebels’ and the EU warning Russians to clean up their act.  The emotional and rhetorical impact is that in some way Russians are to blame for the shelling of cities, and indeed when I read the words to Fiona this was precisely what she assumed.

That is, while the facts are there, they are presented in such a way that the casual reader takes away precisely the opposite of the truth.  In other words, the BBC reporting, whether intentionally or unintentionally, systematically misleads the public.

To be fair, in the earliest version of the article its later parts report first Ukrainian army deaths and then civilian casualties in rebel-held areas:

On Friday morning, a military spokesman in Kiev said eight members of Ukraine’s military had been killed in fighting against separatists in the past 24 hours.

The rebels said shelling killed three civilians in Luhansk, reported AFP news agency.

(Although the second sentence is removed from later versions of the article.)

BBC-news-early-13-Feb-2015-cropped BBC-news-later-13-Feb-2015-cropped
early and later version of same BBC story

The early versions of the article also included an image of a wall in Kiev commemorating Ukrainian army deaths, but not the graphic images of civilian casualties that would be used in other conflicts1. This was later changed to a refugee departing on a bus to Russia ((Later still the image of an armoured vehicle was also added.  I’d not realised before just how much these news stories are post-edited)), which better reflects the facet behind the article.

Of course, this is not a one-sided conflict, and later reports from the region during he day include rebel shelling of government held areas as well as government shelling.  Both sides need to be reported, but the reporting practice seems to be to deliberately obfuscate the far more prevalent Ukrainian army attacks on civilian areas.

If this were just a single news item, it could be just the way things turn out, and other news items might be biased in other directions, but the misreporting is systematic and long term.  Many of BBCs online news items include a short potted history of the conflict, which always says that the current conflict started with Russian annexing of Crimea, conveniently ignoring the violent overthrow of the elected government which led to this.  Similarly the BBC timeline for Ukraine starts in 1991 with the Ukrainian referendum to separate from the USSR, conveniently ignoring the similar overwhelming referendum in Crimea earlier in 1991 to separate from Ukraine2.

To be fair on the journalists on the ground, it is frequently clear that their own raw accounts have a different flavour to the commentary added when footage is edited back in London.

In some way Ukraine could be seen as a special case, the Russians are the bogey men of the today, just like Germany was 100 years ago and France was 100 years previously, it is hard for a journalist to say, “actually in this case they have a point“.

Yet, sadly, the above account could be repeated with different details, but the same underlying message in so many conflicts in frequent times.  Will the media, and the BBC, ever trust the public with the truth, or will ‘news’ always be a B movie?

  1. Maybe this is just deemed too horrifying; a recent Times report of Donetsk morgue includes graphic accounts of shrapnel torn babies, but does not include the Getty images of the morgue preferring an image of an unexploded rocket.[back]
  2. While ignoring the history of Crimea. which does seem germane to the current conflict, the BBC timeline is overall relatively fair; for example, making clear that Yanukovych’s election was “judged free and fair by observers“.[back]

Big themes

We were talking about the big themes, and what bigger theme than Christmas.  John talks of the Word, that pre-exists all, the Logos, the ruliness we seek in random events, the laws of the universe examined in CERN and comet-hugging satellite, the conversation between God and creation, the Word that was singly, irrevocably and powerfully spoken, the Word that says all and is all, the Word that is “Love”.

It was a Word declared through 10 billion years of the dark star-thread universe, a Word sung by incomprehensible angels, a Word of cosmic significance; but it was no abstract Word, no Word of plain intellectual study, but a Word made Flesh.

Wriggling, scrawny, damp-wrinkled flesh, still flecked with the drying blood of Mary torn in childbirth, prefiguring another bloody day, like and unlike every other baby, letting out one unignorable, earth-shaking cry.