Another year – running and walking, changing roles and new books

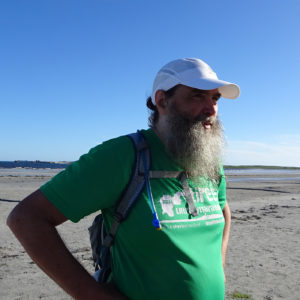
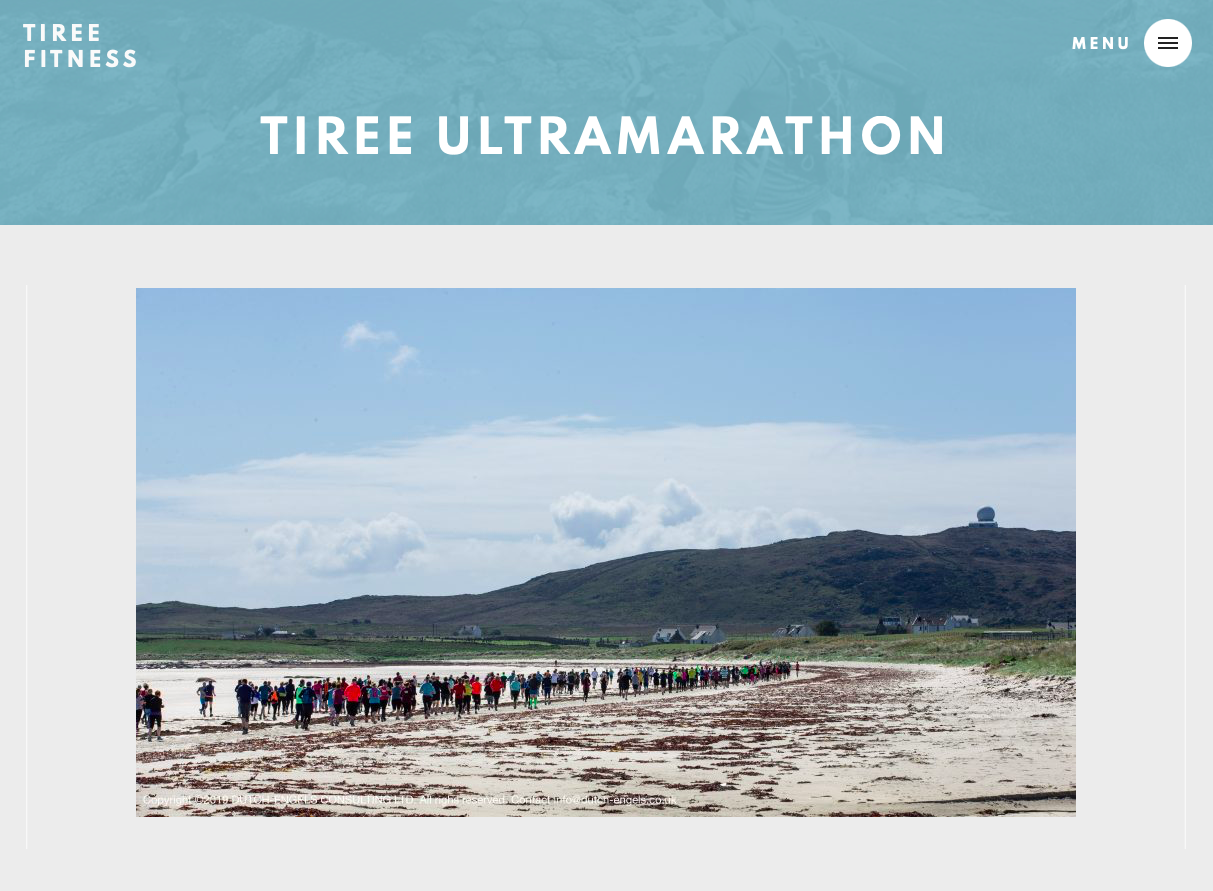
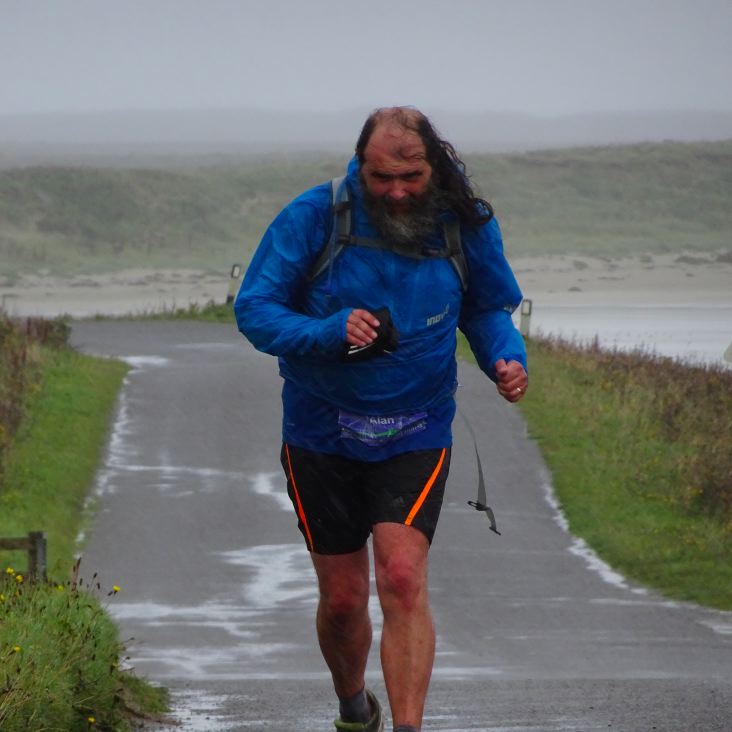
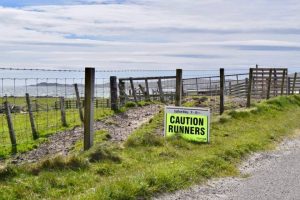
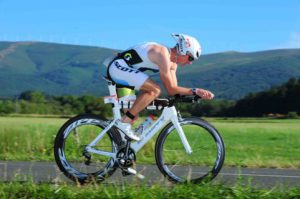
Yesterday I completed the Tiree Ultramarathon, I think my sixth since they began in 2014. As always a wonderful day and a little easier than last year. This is always a high spot in the year for me, and also corresponds to the academic year change, so a good point to reflect on the year past and year ahead.  Lots of things including changing job role, books published and in preparation, conferences coming to Wales … and another short walk …

Tiree Ultra and Tech Wave

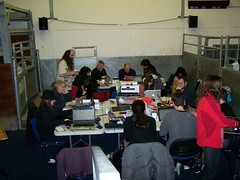
Next week there will be a Tiree Tech Wave, the first since Covid struck. Really exciting to be doing this again, with a big group coming from Edinburgh University, who are particularly interested in co-design with communities.

Aside: I nearly wrote “the first post-Covid Tiree Tech Wave”, but I am very aware that for many the impact of Covid is not past: those with long Covid, immunocompromised people who are in almost as much risk now as at the peak of the pandemic, and patients in hospital where Covid adds considerably to mortality.

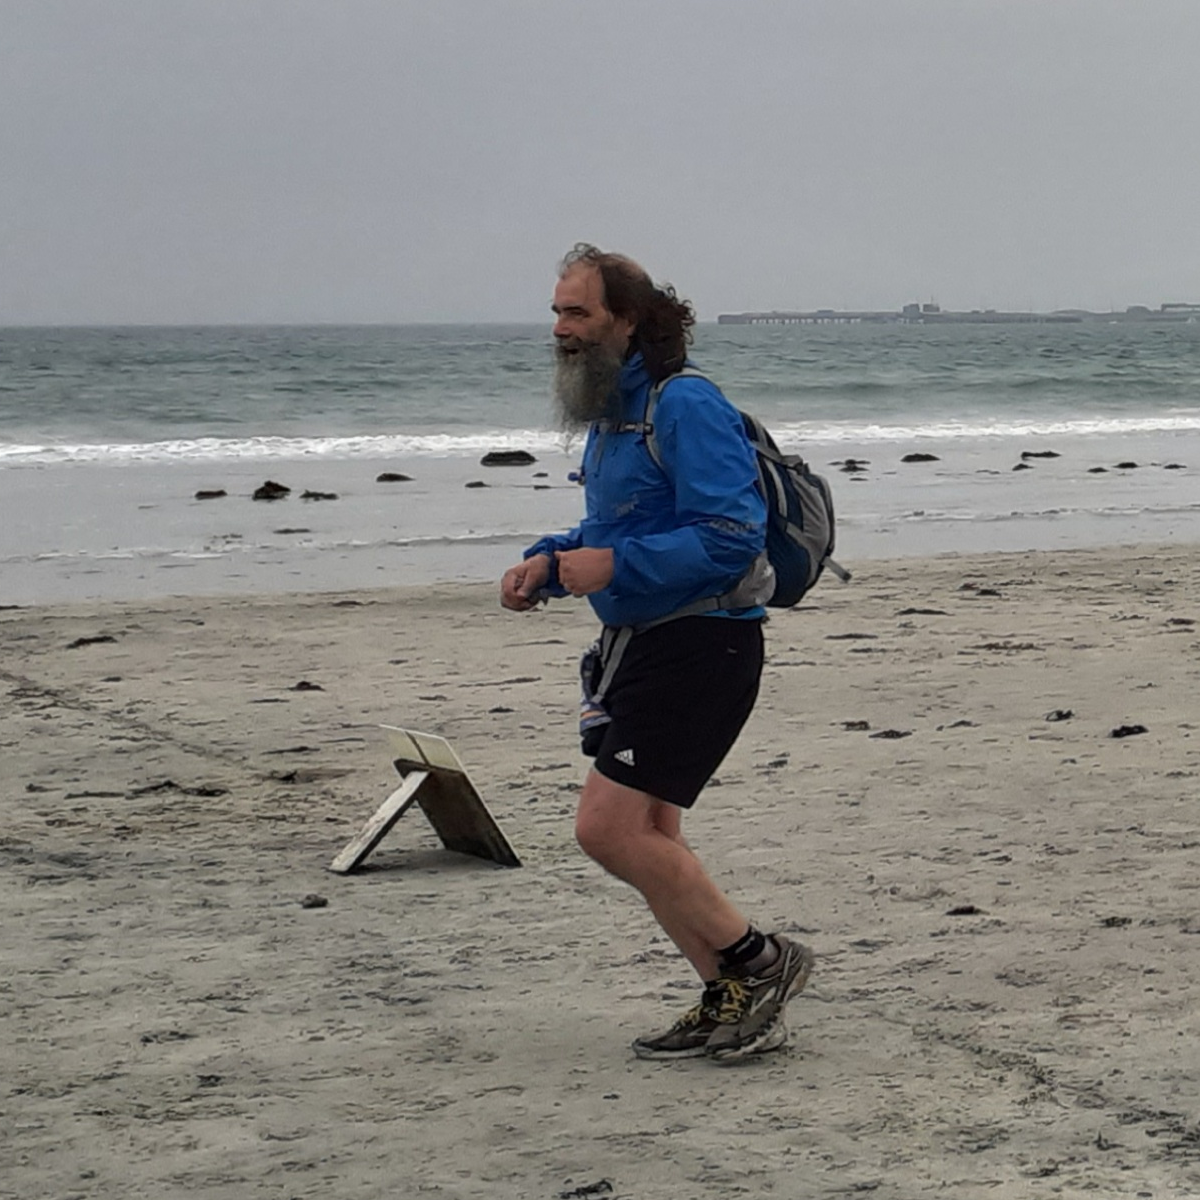
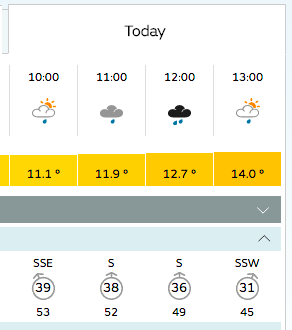
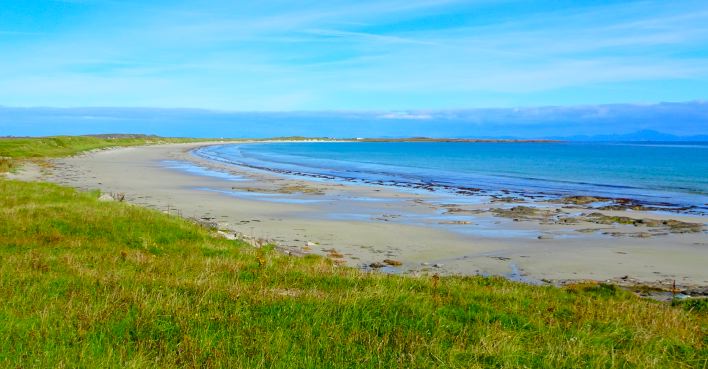
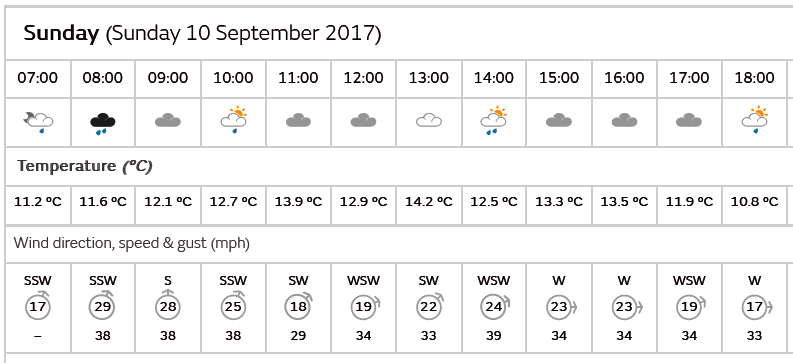
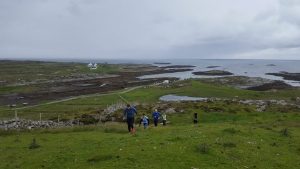
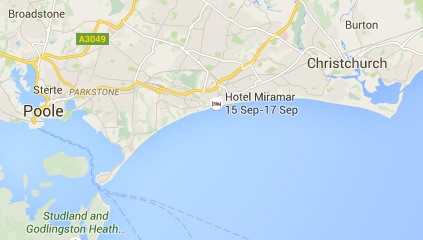
Albrecht Schmidt from Ludwig-Maximilians-Universität München was here again for the Ultra. He’s been several times after first coming the year of 40 mile an hour winds and rain all day … he is built of stern stuff.  Happily, yesterday was a little more mixed, wind and driving rain in the morning and glorious sunshine from noon onwards … a typical Tiree day 😊

We have hatched a plan to have Tiree Tech Wave next year immediately after the Ultra. There are a number of people in the CHI research community interested in technology related to outdoors, exercise and well-being, so hoping to have that as a theme and perhaps attract a few of the CHI folk to the Ultra too.

Changing roles

My job roles have changed over the summer.

I’ve further reduced my hours as Director of the Computational Foundry to 50%. University reorganisation at Swansea over the last couple of years has created a School of Mathematics and Computer Science, which means that some of my activities helping to foster research collaboration between CS and Maths falls more within the School role. So, this seemed a good point to scale back and focus more on cross-University digital themes.

However, I will not be idle! I’ve also started a new PT role as Professorial Fellow at Cardiff Metropolitan University. I have been a visiting professor at the Cardiff School of Art and Design for nearly 10 years, so this is partly building on many of the existing contacts I have there. However, my new role is cross-university, seeking to encourage and grow research across all subject areas. I’ve always struggled to fit within traditional disciplinary boundaries, so very much looking forward to this.

Books and writing

This summer has also seen the publication of “TouchIT: Understanding Design in a Physical-Digital World“. Steve, Devina, Jo and I first conceived this when we were working together on the DePTH project, which ran from 2007 to 2009 as part of the AHRC/EPSRC funded Designing for the 21st Century Initiative. The first parts were written in 2008 and 2009 during my sabbatical year when I first moved to Tiree and Steve was our first visitor. But then busyness of life took over until another spurt in 2017 and then much finishing off and updating. However now it is at long last in print!

Hopefully not so long in the process, three more books are due to be published in this coming year, all around an AI theme. The first is a second edition of the “Introduction to Artificial Intelligence” textbook that Janet Finlay and I wrote way back in 1996. This has stayed in print and even been translated into Japanese. For many years the fundamentals of AI only changed slowly – the long ‘AI winter’. However, over recent years things have changed rapidly, not least driven by massive increases in computational capacity and availability of data; so it seemed like a suitable time to revisit this. Janet’s world is now all about dogs, so I’ve taken up the baton. Writing the new chapters has been easy. The editing making this flow as a single volume has been far more challenging, but after a focused writing week in August, it feels as though I’ve broken the back of it.

In addition, there are two smaller volumes in preparation as part of the Routledge and CRC AI for Everything series. One is with Clara Crivellaro on “AI for Social Justice“, the other a sole-authored “AI for Human–Computer Interaction”.

All of these were promised in 2020 early in the first Covid lockdown, when I was (rather guiltily) finding the time tremendously productive. However, when the patterns of meetings started to return to normal (albeit via Zoom), things slowed down somewhat … but now I think (hope!) all on track 😊

Welcoming you to Wales

In 2023 I’m chairing and co-chairing two conferences in Swansea. In June, ACM Engineering Interactive Computer Systems (EICS 2023) and in September the European Conference on Cognitive Ergonomics (web site to come, but here is ECCE 2022). We also plan to have a Techwave Cymru in March. So I’m looking forward to seeing lots of people in Wales.

As part of the preparation to EICS I’m planning to do a series of regular blog posts on more technical aspects of user interface development … watch this space …

Alan’s on the road again

Nearly ten years ago, in 2013, I walked around Wales, a personal journey and research expedition. I always assumed I would do ‘something else’, but time and life took over. Now, the tenth anniversary is upon me and it feels time do something to mark it.

I’ve always meant to edit the day-by-day blogs into a book, but that certainly won’t happen next year. I will do some work on the dataset of biodata, GPS, text and images that has been used in a few projects and is still a unique data set, including, I believe, still the largest single ECG trace in the public domain.

However, I will do ‘something else’.

When walking around the land and ocean boundaries of Wales, I was always aware that while in some sense this ‘encompassed’ the country, it was also the edge, the outside. To be a walker is to be a voyeur, catching glimpses, but never part of what you see.  I started then to think of a different journey, to the heart of Wales, which for me, being born and brought up in Cardiff, is the coal valleys stretching northwards and outwards. The images of coal blackened miners faces and the white crosses on the green hillside after Aberfan are etched into my own conception of Wales.

So, there will be an expedition, or rather as series of expeditions, walking up and down the valleys, meeting communities, businesses, schools and individuals.

Do you know places or people I should meet?

Do you want to join me to show me places you know or to explore new places?

Busy September – talks, tutorials and an ultra-marathon

September has been a full month!

During the last two weeks things have started to kick back into action, with the normal rounds of meetings and induction week for new students.  For the latter I’d pre-recorded a video welcome, so my involvement during the week was negligible.  However, in addition I delivered a “Statistics for HCI” day course organised by the BCS Interaction Group with PhD students from across the globe and also a talk “Designing User Interactions with AI: Servant, Master or Symbiosis” at the AI Summit London.  I was also very pleased to be part of the “60 faces of IFIP” campaign by the International Federation for Information Processing.

It was the first two weeks that stood out though, as I was back on Tiree for two whole weeks.  Not 100% holiday as during the stay I gave two virtual keynotes: “Qualitative–Quantitative Reasoning: thinking informally about formal things” at the International Colloquium on Theoretical Aspects of Computing (ICTAC) in Kazakhstan and “Acting out of the Box” at the University of Wales Trinity St David (UWTSD) Postgraduate Summer School.  I also gave a couple of lectures on “Modelling interactions: digital and physical” at the ICTAC School which ran just before the conference and presented a paper on “Interface Engineering for UX Professionals” in the Workshop on HCI Engineering Education (HCI-E2) at INTERACT 2021 in Bari.  Amazing how easy it is to tour the world from a little glamping pod on a remote Scottish Island.

Of course the high point was not the talks and meetings, but the annual Tiree Ultra-marathon.  I’d missed last year, so especially wonderful to be back: thirty five miles of coastline, fourteen beaches, not to mention so many friendly faces, old friends and new.  Odd of course with Covid zero-contact and social distancing – the usual excited press of bodies at the pre-race briefing in An Talla, the Tiree community hall, replaced with a video webinar and all a little more widely spaced for the start on the beach too.

The course was slightly different too, anti-clockwise and starting half way along Gott Bay, the longest beach.  Gott Bay is usually towards the end of the race, about 28 miles in, so the long run, often into the wind is one of the challenges of the race.  I recall in 2017 running the beach with 40 mile an hour head wind and stinging rain – I knew I’d be faster walking, but was determined to run every yard of beach..  Another runner came up behind me and walked in my shelter.  However, this year had its own sting in the tail with Ben Hynish, the highest point, at 26 miles in.

The first person was across the line in about four-and-a-quarter hours, the fastest time yet.  I was about five hours later!

This was my fifth time doing the ultra, but the hardest yet, maybe in part due to lockdown couch-potato-ness!  My normal training pattern is that about a month before the ultra I think, “yikes, I’ve not run for a year” and then rapidly build up the miles – not the recommended training regime!  This year I knew I wasn’t as fit as usual, so I did start in May … but then got a knee injury, then had to self-isolate … and then it was into the second-half of July; so about a month again.

Next year it will be different, I will keep running through the winter … hmm … well, time will tell!

The different September things all sound very disparate – and they are, but there are some threads and connections.

The first thread is largely motivational.

The UWTSD keynote was about the way we are not defined by the “kind of people” we think of ourselves as being, but by the things we do.  The talk used my walk around Wales in 2013 as the central example, but the ultra would have been just as pertinent.  Someone with my waistline is not who one would naturally think as being an ultramarathon runner – not that kind of person, but I did it.

However, I was not alone.  The ‘winners’ of the ultra are typically the rangy build one would expect of a long-distance runner, but beyond the front runners, there is something about the long distance that attracts a vast range of people of all ages, and all body shapes imaginable.  For many there are physical or mental health stories: relationship breakdowns, illnesses, that led them to running and through it they have found ways to believe in themselves again.  Post Covid this was even more marked: Will, who organises the ultra, said that many people burst into tears as they crossed the finish line, something he’d never seen before.

The other thread is about the mental tools we need to be a 21st century citizen.

The ICTAC keynote was about “Qualitative–Quantitative Reasoning”, which is my term for the largely informal understanding of numbers that is so important for both day-to-day and professional life, but is not part of formal education.  The big issues of our lives from Covid to Brexit to climate change need us to make sense of large-scale numerical or data-rich phenomena.  These often seem too complex to make sense of, yet are ones where we need to make appropriate choices in both our individual lives and political voices.  It is essential that we find ways to aid understanding in the public, press and politicians – including both educational resources and support tools.

The statistics course and my “Statistics for HCI” book are about precisely this issue – offering ways to make sense of often complex results of statistical analysis and obtain some of the ‘gut’ understanding that professional statisticians develop over many years.

My 60 faces of IFIP statement also follows this broad thread:

“Digital techology is now essential to being a citizen. The future of information processing is the future of everyone; so needs to be understood and shaped by all. Often ICT simply reinforces existing patterns, but technology is only useful if we can use it to radically reimagine a better world.


More information on different events

Tiree Ultra

Tiree Ultramarathon web page and Facebook Group

Paper: Interface Engineering for UX Professionals

HCI-E2: Workshop on HCI Engineering Education – for developers, designers and more, INTERACT 2021, Bari, Italy – August 31st, 2021. See more – paper and links

Summer School Lecturea: Modelling interactions: digital and physical

Lecture at ICTAC School 2021: 18th International Colloquium on Theoretical Aspects of Computing, Nazarbayev University, Nur-Sultan, Kazakhstan, 1st September 2021. See more – abstract and links

Talk: Designing User Interactions with AI: Servant, Master or Symbiosis

The AI Summit London, 22nd Sept. 2021. See moreabstract and links

Day Course: Statistics for HCI

BCS Interaction Group One Day Course for PhD Students, 21st Sept. 2021.
See my Statistics for HCI Micro-site.

Keynote: Acting out of the Box

Rhaglen Ysgol Haf 2021 PCYDDS / UWTSD Postgraduate Summer School 2021, 10th Sept. 2021. See more – abstract and links

Keynote: Qualitative–Quantitative Reasoning: thinking informally about formal things

18th International Colloquium on Theoretical Aspects of Computing, Nazarbayev University, Nur-Sultan, Kazakhstan, 10th Sept. 2021. See more – full paper and links

Induction week greeting


Everything feels easy

Today looked like a good Tiree Ultra day, with 40 mile an hour winds (the odd gust at 50) and occasional shafts of sunshine between driving rain!

So buoyed by knowledge from three weeks ago that I could do it, I took my first run since the ultra.

My left leg is still feeling a little gammy, but with a 40 mph wind at my back I fair sailed along – until I turned round.  Progress on the return leg was … well suffice say I could have walked faster.

I have always avoided running in the rain, but after the ultra I knew I could do it and it wasn’t so bad.  I also had a new rain poof that I’d got for the ultra – good equipment really does help.

There is something liberating about that “it can’t be worse than …” feeling.

When I did the first Tiree Ultramarathon in 2014, it was a year after I’d walked around Wales.  If I got a pain whilst walking there was always the fear that it would be worse the next day, or that it would be the thing that stopped me entirely.

Just over 2/3 of the way round the 2014 ultra I began to get some pain in my right leg.  I’d pulled the Achilles tendon on that ankle a few years before, and so I was a little worried that it would go again.  But I thought, “only 10 miles to go, and it’s just one day. I don’t have to run again tomorrow and the next day; so what if I’m hobbling for a few weeks.

After walking 1000 miles day on day, a single day and mere 35 miles was suddenly less daunting.

Now, knowing I could endure a whole day running with horizontal rain stinging my cheeks, well what of a couple of miles in heavy drizzle and 50 mile an hour winds …

After Tiree Ultra 2017, everything feels easy.

Tiree Ultra 2017 – what a difference a week makes

Last Sunday I completed my third Tiree Ultamarathon … and definitely the wettest, windiest and boggiest!

However, this Sunday what a difference …

The ultra circuit flows the coast of Tiree taking in almost all of the beaches, but also includes some road sections as well as off-road grass sward and boggy moor. There is relatively little height gain, but Will Wright tries to organise the route to ‘make the most’ of the hills there are.

Previous years have been wonderful weather, light breeze and some sun, enough to be pleasant, but not enough to cause heat problems. However, the fates had been saving their fury, and this year the heavens opened and Odysseus let the western winds loose gathering water from the warm Atlantic and flinging it at us in horizontal sheets.

It was the first time I had every run in the rain so was, well maybe not a baptism of fire, but certainly a dramatic introduction., I had recently bought a waterproof for running in, but it sill had its label on as each wet August day, I thought “well maybe run on a brighter day”. Although everyone says that the right equipment helps, I sort of only half believed it – however, I was amazed at how even driving rain was not a problem.

I only run the Tiree ultra in September and sometimes the Tiree half marathon in May. I always mean to keep on running between, but then I forget, or I am too busy – so many excuses. So, in previous years I haven’t got round to any running until a month before the ultra doubling my distance each week – far from the recommended 10-15% a week increase! To be honest I’ve been very lucky to have not injured myself.

This year I decided to break my habit and be well prepared, so started a whole two months in advance. I wondered if this had been wise as I felt I’d peaked at the end of July and seemed to be going downhill ever since.  However, this year I am definitely hobbling less afterwards and I managed to run every inch of road and beach, with just a few walking sections over bog. This said, when the wind gusted mid to high thirty miles an hour in my face, I would almost certainly have walked faster than I ran.  Indeed on Gott Bay as I ran (very slowly) into the wind another runner was power walking just behind me sheltering in my lee.

One thing I noticed while running was a subtle change in psychology.  After about 10 miles, as pain and exhaustion kicked in, I was aware of myself occasionally wondering if there was any way I could bow out without losing too much face, and then not that many miles later I caught myself thinking “next year I’ll ….” – at that point I knew I was OK!  However, the exhaustion must still have been in my face at mile 17 as the marshal as we came off the beach at Balephetrish said, “you look as if you could do with a hug”.

This year two off-island friends, Albrecht and Alun, also came to Tiree for the Ultra, which was wonderful.  Being a good host I of course let them finish ahead of me by an hour or so 😉

Albrecht has already booked for next year, but not sure if Alun is convinced!

However, the weather can only be better.


running on the verge

Tiree Fitness Facebook – Photo by Alan Millar

In a week and half’s time I’ll be joining about 250 others on the Tiree Ultramarathon, running around the edge of Tiree, which is itself on the Atlantic edge of Scotland.   Some of this will be on beach and moor, but some along single track roads, where you often have to step onto the grassy verge as cars go by.

Running on the verge has its own challenges which I’m sure are shared by many rural areas as well as Tiree.  For those coming to the Tiree Ultra or running (or cycling) in rural areas, here’s my short guide to the hazards of the verge.

on narrow roads do stop – Some roads do have space for a car to pass a runner or cyclist, but it can be close especially if you are a little tired and ‘wandering’ a little as you run.  So usually best to stop … and you get a moments breather 😉

beware the ragged tarmac edge – It is tempting to just squeeze to the left and keep going, but the tarmac often peters out, this is worst of you are cycling as the wheel can slip off the road and get trapped in the furrow between tarmac ad grass (cyclists have ended up in hospital!), but you can also trip when running … and you don’t want to fall into the path of the car that is passing.

Tiree Fitness Facebook photos – verges are not the only road hazard

running on the verge – I know many will ignore this, but just don’t.  They seem wide, tamer than running on full off-road terrain, and well within the capabilities of a off-road bike.  However there are often drainage channels hidden by the long grass – these can be a foot or more deep and can be invisible.  Even when there isn’t a deep drainage channel running parallel to the road, there are often smaller drainage channels running outwards from the road; these are typically only a few inches deep, but just designed to trip you up.  The one possible exception is where someone has mown the verge outside their house, but even then be careful of the cross-channels as they often aren’t obvious even on mown grass.

stepping onto the verge – At the risk of sounding like your granny, still take care!  I have stepped off the road and, even looking down at the ground as I did so, my foot has disappeared into a channel and I’ve almost sprained my ankle … and that was standing still not running.  On the bike be even more careful, you stop, put your outer foot into what you believe to be grass and … on a bike there is little you can do apart from topple full head over heels … and, yes, I know because I have done it.

standing on the verge – Will it never stop!  Yep, even standing has it’s dangers.  On Tiree it is normal to wave to those passing, friend and stranger alike.  However, if you are a little tired twisting round can put you off balance.  Don’t feel embarrassed to put a hand on a fence post to keep you sure footed, better than stumbling back into the path of that nicely waving driver.

stepping off the verge – Do take a peek back down the road before stepping back onto the tarmac.  Tiree is windy and when the wind is coming from in front it is hard to hear cars from behind, as a car passes you it is easy to just step back, but often there is a second car driving in convoy, especially when the road has had a lot of obstacles (such as runners), so that cars catch up with one another.

Tiree Fitness Facebook photos

… and then if you survive the verges

… there is just Dun Mor to climb …

why is the wind always against you? part 2 – side wind

In the first part of this two-part post, we saw that cycling into the wind takes far more additional effort than a tail wind saves.

However, Will Wright‘s original question, “why does it feel as if the wind is always against you?” was not just about head winds, but the feeling that when cycling around Tiree, while the angle of the wind is likely to be in all sorts of directions, it feels as though it is against you more than with you.

Is he right?

So in this post I’ll look at side winds, and in particular start with wind dead to the side, at 90 degrees to the road.

Clearly, a strong side wind will need some compensation, perhaps leaning slightly into the wind to balance, and on Tiree with gusty winds this may well cause the odd wobble.  However, I’ll take best case scenario and assume completely constant wind with no gusts.

There is a joke about the engineer, who, when asked a question about giraffes, begins, “let’s first assume a spherical giraffe”.  I’m not gong to make Will + bike spherical, but will assume that the air drag is similar in all directions.

Now my guess is that given the way Will is bent low over his handle-bars, he may well actually have a larger side-area to the wind than from in front.  Also I have no idea about the complex ways the moving spokes behave as the wind blows through them, although I am aware that a well-designed turbine absorbs a fair proportion of the wind, so would not be surprised if the wheels added a lot of side-drag too.

If the drag for a side wind is indeed bigger than to the front, then the following calculations will be worse; so effectively working with a perfectly cylindrical Will is going to be a best case!

To make calculations easy I’ll have the cyclist going at 20 miles an hour, with a 20 mph side wind also.

When you have two speeds at right angles, you can essentially ‘add them up’ as if they were sides of a triangle.  The resultant wind feels as if it is at 45 degrees, and approximately 30 mph (to be exact it is 20 x √2, so just over 28mph).

Recalling the squaring rule, the force is proportional to 30 squared, that is 900 units of force acting at 45 degrees.

In the same way as we add up the wind and bike speeds to get the apparent wind at 45 degrees, we can break this 900 unit force at 45 degree into a side force and a forward drag. Using the sides of the triangle rule, we get a side force and forward drag of around 600 units each.

For the side force I’ll just assume you lean into (and hope that you don’t fall off if the wind gusts!); so let’s just focus on the forward force against you.

If there were no side wind the force from the air drag would be due to the 20 mph bike speed alone, so would be (squaring rule again) 400 units.  The side wind has increased the force against you by 50%.  Remembering that more than three quarters of the energy you put into cycling is overcoming air drag, that is around 30% additional effort overall.

Turned into head speed, this is equivalent to the additional drag of cycling into a direct head wind of about 4 mph (I made a few approximations, the exact figure is 3.78 mph).

This feels utterly counterintuitive, that a pure side wind causes additional forward drag!  It perhaps feels even more counterintuitive if I tell you that in fact the wind needs to be about 10 degrees behind you, before it actually helps.

There are two ways to understand this.

The first is plain physics/maths.

For very small objects (around a 100th of a millimetre) the air drag is directly proportional to the speed (linear).  At this scale, when you redivide the force into its components ahead and to the side, they are exactly the same as if you look at the force for the side-wind and cycle speed independently.  So if you are a cyclist the size of an amoeba, side winds don’t feel like head winds … but then that is probably the least of your worries.

For ordinary sized objects, the squaring rule (quadratic drag) means that after you have combined the forces, squared them and then separated them out again, you get more than you started with!

The second way to look at it, which is not the full story, but not so far from what happens, is to consider the air just in front of you as you cycle.

You’ll know that cyclists often try to ride in each other’s slipstream to reduce drag, sometimes called ‘drafting’.

The lead cyclist is effectively dragging the air behind, and this helps the next cyclist, and that cyclist helps the one after.  In a race formation, this reduces the energy needed by the following riders by around a third.

In addition you also create a small area in front where the air is moving faster, almost like a little bubble of speed.  This is one of the reasons why even the lead cyclist gains from the followers, albeit much less (one site estimates 5%).  Now imagine adding the side wind; that lovely bubble of air is forever being blown away meaning you constantly have to speed up a new bubble of air in front.

I did the above calculations for an exact side wind at 90 degrees to make the sums easier. However, you can work out precisely how much additional force the wind causes for any wind direction, and hence how much additional power you need when cycling.

Here is a graph showing that additional power needed, ranging for a pure head wind on the right, to a pure tail wind on the left (all for 20 mph wind).  For the latter the additional force is negative – the wind is helping you. However, you can see that the breakeven point is abut 10 degrees behind a pure side wind (the green dashed line).  Also evident (depressingly) is that the area to the left – where the wind is making things worse, is a lot more than the area to the right, where it is helping.

… and if you aren’t depressed enough already, most of my assumptions were ‘best case’.  The bike almost certainly has more side drag than head drag; you will need to cycle slightly into a wind to avoid being blown across the road; and, as noted in the previous post, you will cycle more slowly into a head wind so spend more time with it.

So in answer to the question …

why does it feel as if the wind is always against you?

… because most of the time it is!

why is the wind always against you? part 1 – head and tail winds

Sometimes it feels like the wind is always against you.

Is it really?

I’ve just been out for a run.  It is not terribly windy today by Tiree standards, the Met Office reports the speed at 18mph from the north west, but it was enough to feel as I ran and certainly the gritted teeth of cyclists going past the window suggests is plenty windy for them.

As I was running I remembered a question that Will Wright once asked me, “why does it feel as if the wind is always against you?

Now Will competes in Iron Man events, and is behind Tiree Fitness, which organises island keep fit activities, and the annual Tiree 10k & half marathon and Ultra-Marathon (that I’m training for now).  In other words Will is in a different league to me … but still he feels the wind!

Will was asking about cycling rather than running, and I suspect that the main effect of a head wind for a runner is simply the way it knocks the breath out of you, rather than actual wind resistance.  That is, as most things in exercise, the full story is a mixture of physiology, psychology and physics.

For this post I’ll stick to the ‘easy’ cases when the wind is dead in front or behind you.  I’ll leave sidewinds to a second post as the physics for this is a little more complicated, and the answer somewhat more surprising.

In fact today I ran to and fro along the same road, although its angle to the wind varied.  For the purposes of this post I’ll imagine straightening it more, and having it face directly along the direction of the wind, so that running or cycling one way the wind is directly behind you and in the other the wind is directly in front.

running with the wind

To make the sums easier I’ll make the wind speed 15 mph and have me run at 5mph.

On the outward leg the wind is behind me.  I am running at 5mph, the wind is coming at 15mp, so if I had a little wind gauge as I ran it would register a 10mph tail wind.

When I turn into the wind I am now running at 5mph into a 15mph head wind, so the apparent wind speed for me is 20mph.

So half the time the wind is helping me to the tune of 10mph, half the time resisting me by 20mph, so surely that averages out as 5mph resistance for the whole journey, the same as if I was just running at 5mph on a  still day?

average apparent wind (?) = (  –10 * 4 miles  +  +20 * 4 miles ) / 8 miles = 5

Unfortunately wind resistance does not average quite like that!

Wind resistance increases with the square of your speed.  So a 10mph tail wind creates 100 units of force to help you, whereas a 20mph head wind resists you with 400 units of force, four times as much.  That is, it is like one person pushing you from behind for half the course, but four people holding you back on the other half.

It is this force, the squared speed, that it makes more sense to average

average resistance (wind) = (  –100 * 4 miles  +  +400 * 4 miles ) / 8 miles = 150

Compare this to the effects of running on a still day at 5mph.

average resistance (no wind) = 25  (5 squared)

The average wind resistance over the course is six times as much even though half the distance is into the wind and half the distance is away from it.

It really is harder!

In fact, for a runner, wind resistance (physics) is probably not the major effect on speed, and despite the wind my overall time was not significantly slower than on a still day.  The main effects of the wind are probably the ‘knocking the breath out of you’ feeling and the way the head wind affects your stride (physiology).  Of course both of these make you more aware of the times the wind is in your face and hence your perception of how long this is (psychology).

cycling hard

For a cyclist wind resistance is a far more significant issue1.  Think about Olympic sprinters who run upright compared with cyclists who bend low and even wear those Alien-like cycling helmets to reduce drag.

This is partly due to the different physical processes, for example, on bike on a still day, the bike will keep on going forward even if you don’t pedal, whereas if you don’t keep moving your legs while running you get nowhere.

It is also partly due to the different speeds.  Even Usain Bolt only manages a bit over 20mph and that for just 100 metres, and for long-distance runners this drops to around 12 mph.  Equivalent cycling events are twice as fast and even a moderately fit cyclist could compete with Usain Bolt.

So let’s imagine our Tiree cyclist, grimacing as they head into the wind.

I’m going to assume they are cycling at 15mph.

If it were a still day the air resistance would be entirely due to their own forward speed of 15mph, hence (squared remember) 225 units of force against them.

However, with a 15mph wind, when they are cycling with the wind there is no net air flow, the only effort needed to cycle is the internal resistance of chain and gears, and the rubber on the road.  In contrast, when cycling against the wind, total air resistance is equivalent to 30mph. Recalling the squaring rule, that is 900 units of resistance, 4 times as high as on a still day.

Even averaging with the easy leg, you have twice as much effort needed to overcome the air resistance.  No wonder it feels tough!

However, that is all assuming you keep a constant speed irrespective of the wind.  In practice you are likely to slow down against a head wind and speed up with a tail wind.  Let’s assume you slow down to 10mph in the head wind and manage a respectable 20mph with the wind behind you.

I’ll not do the force calculations as the numbers get a little less tidy, but crucially this means you spend twice as long doing the head wind leg as the tail wind leg.  Although you cycle the same distance with head and tail winds, you spend twice as long battling that head wind.  And I’ll bet with it feeling so tough, it seems like even longer!


  1. The Wikipedia page on Bicycle performance includes estimates suggesting over 75% of effort is overcoming drag … even with no wind[back]

level of detail – scale matters

We get used to being able to zoom into every document picture and map, but part of the cartographer’s skill is putting the right information at the right level of detail.  If you took area maps and then scaled them down, they would not make a good road atlas, the main motorways would hardly be visible, and the rest would look like a spider had walked all over it.  Similarly if you zoom into a road atlas you would discover the narrow blue line of each motorway is in fact half a mile wide on the ground.

Nowadays we all use online maps that try to do this automatically.  Sometimes this works … and sometimes it doesn’t.

Here are three successive views of Google maps focused on Bournemouth on the south coast of England.

On the first view we see Bournemouth clearly marked, and on the next, zooming in a little Poole, Christchurch and some smaller places also appear.  So far, so good, as we zoom in more local names are shown as well as the larger place.

bournemouth-1  bournemouth-2

However, zoom in one more level and something weird happens, Bournemouth disappears.  Poole and Christchurch are there, but no  Bournemouth.

bournemouth-3

However, looking at the same level scale on another browser, Bournemouth is there still:

bournemouth-4

The difference between the two is the Hotel Miramar.  On the first browser I am logged into Google mail, and so Google ‘knows’ I am booked to stay in the Hotel Miramar (presumably by scanning my email), and decides to display this also.   The labels for Bournemouth and the hotel label overlap, so Google simply omitted the Bournemouth one as less important than the hotel I am due to stay in.

A human map maker would undoubtedly have simply shifted the name ‘Bournemouth’ up a bit, knowing that it refers to the whole town.  In principle, Google maps could do the same, but typically geocoding (e.g. Geonames) simply gives a point for each location rather than an area, so it is not easy for the software to make adjustments … except Google clearly knows it is ‘big’ as it is displayed on the first, zoomed out, view; so maybe it could have done better.

This problem of overlapping legends will be familiar to anyone involved in visualisation whether map based or more abstract.

cone-trees

The image above is the original Cone Tree hierarchy browser developed by Xerox PARC in the early 1990s1.  This was the early days of interactive 3D visualisation, and the Cone Tree exploited many of the advantages such as a larger effective ‘space’ to place objects, and shadows giving both depth perception, but also a level of overview.  However, there was no room for text labels without them all running over each other.

Enter the Cam Tree:

cam-tree

The Cam Tree is identical to the cone tree, except because it is on its side it is easier to place labels without them overlapping 🙂

Of course, with the Cam Tree the regularity of the layout makes it easy to have a single solution.  The problem with maps is that labels can appear anywhere.

This is an image of a particularly cluttered part of the Frasan mobile heritage app developed for the An Iodhlann archive on Tiree.  Multiple labels overlap making them unreadable.  I should note that the large number of names only appear when the map is zoomed in, but when they do appear, there are clearly too many.

frasan-overlap

It is far from clear how to deal with this best.  The Google solution was simply to not show some things, but as we’ve seen that can be confusing.

Another option would be to make the level of detail that appears depend not just on the zoom, but also the local density.  In the Frasan map the locations of artefacts are not shown when zoomed out and only appear when zoomed in; it would be possible for them to appear, at first, only in the less cluttered areas, and appear in more busy areas only when the map is zoomed in sufficiently for them to space out.   This would trade clutter for inconsistency, but might be worthwhile.  The bigger problem would be knowing whether there were more things to see.

Another solution is to group things in busy areas.  The two maps below are from house listing sites.  The first is Rightmove which uses a Google map in its map view.  Note how the house icons all overlap one another.  Of course, the nature of houses means that if you zoom in sufficiently they start to separate, but the initial view is very cluttered.  The second is daft.ie; note how some houses are shown individually, but when they get too close they are grouped together and just the number of houses in the group shown.

rightmove-houses  daft-ie-house-site

A few years ago, Geoff Ellis and I reviewed a number of clutter reduction techniques2, each with advantages and disadvantages, there is no single ‘best’ answer. The daft.ie grouping solution is for icons, which are fixed size and small, the text label layout problem is far harder!

Maybe someday these automatic tools will be able to cope with the full variety of layout problems that arise, but for the time being this is one area where human cartographers still know best.

  1. Robertson, G. G. ; Mackinlay, J. D. ; Card, S. K. Cone Trees: animated 3D visualizations of hierarchical informationProceedings of the ACM Conference on Human Factors in Computing Systems (CHI ’91); 1991 April 27 – May 2; New Orleans; LA. NY: ACM; 1991; 189-194.[back]
  2. Geoffrey Ellis and Alan Dix. 2007. A Taxonomy of Clutter Reduction for Information VisualisationIEEE Transactions on Visualization and Computer Graphics 13, 6 (November 2007), 1216-1223. DOI=10.1109/TVCG.2007.70535[back]

WebSci 2015 – WebSci and IoT panel

Sunshine on Keble quad, brings back memories of undergraduate days at Trinity, looking out toward the Wren Library.

Yesterday was first day of WebSci 2015.  I’m here largely as I’m giving my work on comparing REF outcomes with citation measures, “Citations and Sub-Area Bias in the UK Research Assessment Process”, at the workshop on “Quantifying and Analysing Scholarly Communication on the Web” on Tuesday.

However, yesterday I was also on a panel on “Web Science & the Internet of Things”.

These are some of the points I made in my initial positioning remarks.  I talked partly about a few things sorting round the edge of Internet of Things (IoT) and then some concerts examples of IoT related rings I;ve been involved with personally and use these to mention  few themes that emerge.

Not quite IoT

Talis

Many at WebSci will remember Talis from its SemWeb work.  The SemWeb side of the business has now closed, but the education side, particularly Reading List software with relationships between who read what and how they are related definitely still clear WebSci.  However, the URIs (still RDF) of reading items are often books, items in libraries each marked with bar codes.

Years ago I wrote about barcodes as one of the earliest and most pervasive CSCW technologies (“CSCW — a framework“), the same could be said for IoT.  It is interesting to look at the continuities and discontinuities between current IoT and these older computer-connected things.

The Walk

In 2013 I walked all around Wales, over 1000 miles.  I would *love* to talk about the IoT aspects of this, especially as I was wired up with biosensors the whole way.  I would love to do this, but can’t , because the idea of the Internet in West Wales and many rural areas is a bad joke.  I could not even Tweet.  When we talk about the IoT currently, and indeed anything with ‘Web’ or ‘Internet’ in its name, we have just excluded a substantial part of the UK population, let alone the world.

REF

Last year I was on the UK REF Computer Science and Informatics Sub-Panel.  This is part of the UK process for assessing university research.  According to the results it appears that web research in the UK is pretty poor.   In the case of the computing sub-panel, the final result was the outcome of a mixed human and automated process, certainly interesting HCI case study of socio-technical systems and not far from WeSci concerns.

This has very real effects on departmental funding and on hiring and investment decisions within universities. From the first printed cheque, computer systems have affected the real world, while there are differences in granularity and scale, some aspects of IoT are not new.

Later in the conference I will talk about citation-based analysis of the results, so you can see if web science really is weak science 😉

Clearly IoT

Three concrete IoT things I’ve been involved with:

Firefly

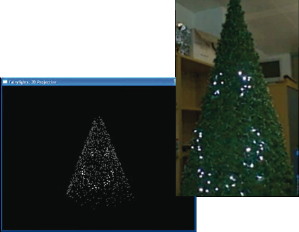
While at Lancaster Jo Finney and I developed tiny intelligent lights. After more than ten years these are coming into commercial production.

Imagine a Christmas tree, and put a computer behind each and every light – that is Firefly.  Each light becomes a single-pixel network computer, which seems like technological overkill, but because the digital technology is commoditised, suddenly the physical structures of wires and switches is simplified – saving money and time and allowing flexible and integrated lighting.

Even early prototypes had thousands of computers in a few square metres.  Crucially too the higher level networking is all IP.  This is solid IoT territory.  However, like a lot of smart-dust, and sensing technology based around homogeneous devices and still, despite computational autonomy, largely centrally controlled.

While it may be another 10 years before it makes the transition from large-scale display lighting to domestic scale; we always imagined domestic scenarios.  Picture the road, each house with a Christmas tree in its window, all Firefly and all connected to the internet, light patterns more form house to hose in waves, coordinate twinkling from window to window glistening in the snow.  Even in tis technology issues of social interaction and trust begin to emerge.

FitBit

My wife has a FitBit.  Clearly both and IoT technology and WebSci phenomena with millions of people connecting their devices into FitBit’s data sharing and social connection platform.

The week before WebSci we were on holiday, and we were struggling to get her iPad’s mobile data working.  The Vodafone website is designed around phones, and still (how many iPads!) misses crucial information essential for data-only devices.

The FitBit’s alarm had been set for an early hour to wake us ready to catch the ferry.  However, while the FitBit app on the iPad and the FitBit talk to one another via Bluetooth, the app will not control the alarm unless it is Internet connected.  For the first few mornings of our holiday at 6am each morning …

Like my experience on the Wales walk the software assumes constant access to the web and fails when this is not present.

Tiree Tech Wave

I run a twice a year making, talking and thinking event, Tiree Tech Wave, on the Isle of Tiree.  A wide range of things happen, but some are connected with the island itself and a number of island/rural based projects have emerged.

One of these projects, OnSupply looked at awareness of renewable power as the island has a community wind turbine, Tilly, and the emergence of SmartGrid technology.  A large proportion of the houses on the island are not on modern SmartGrid technology, but do have storage heating controlled remotely, for power demand balancing.  However, this is controlled using radio signals, and switched as large areas.  So at 4am each morning all the storage heating goes on and there is a peak.  When, as happens occasionally, there are problems with the cable between the island and the mainland, the Island’s backup generator has to deal with this surge, it cannot be controlled locally.  Again issuss of connectivity deeply embedded in the system design.

We also have a small but growing infrastructure of displays and sensing.

We have, I believe, the worlds first internet-enabled shop open sign.  When the café is open, the sign is on, this is broadcast to a web service, which can then be displayed in various ways.  It is very important in a rural area to know what is open, as you might have to drive many miles to get to a café or shop.

We also use various data feeds from the ferry company, weather station, etc., to feed into public and web displays (e.g. TireeDashboard).  That is we have heterogeneous networks of devices and displays communicating through web apis and services – good Iot and WebSCi!

This is part of a broader vision of Open Data Islands and Communities, exploring how open data can be of value to small communities.  On their own open environments tend to be most easily used by the knowledgeable, wealthy and powerful, reinforcing rather than challenging existing power structures.  We have to work explicitly to create structures and methods that make both IoT and the potential of the web truly of benefit to all.


It started with a run … from a conversation at Tiree Tech Wave to an award-winning project

Spring has definitely come to Tiree and in the sunshine I took my second run of the year. On Soroby beach I met someone else out running and we chatted as we ran. It reminded me of another run two years ago …

It was spring of 2013 and a busy Tiree Tech Wave with the launch of Frasan on the Saturday evening. A group had come from the Catalyst project in Lancaster, including Maria Ferrario and she had mentioned running when she arrived, so I said I’d do a run with her. Only later did I discover that her level of running was somewhat daunting, competing in marathons with times that made me wonder if I’d survive the outing.

Happily, Maria modified her pace to reflect my abilities, and we took a short run from the Rural Centre to Chocolates and Charms (good to have a destination), indirectly via Soroby Beach, where I ran today.

Running across the sand we talked about smart grids, and the need to synchronise energy use with renewable supply, and from the conversation the seeds of an idea grew.

fiona-crossapol-beach-2663997355_ea73a75f4c_z-cropped

I started my walk round Wales almost immediately after (with the small matter of my daughter’s wedding in between), but Maria went back to Lancaster and talked to Adrian Friday, who put together a project proposal (with the occasional, very slow email interchange when I could get Internet connections). Towards the end of the summer we heard we had been short-listed and I joined Adrian via Skype for an interview in July.

… and we were successful 🙂

The OnSupply project was born.

OnSupply was a sub-project of the Lancaster Catalyst project. The wider Catalyst project’s aims were to understand better the processes by which advanced technology could be used by communities. OnSupply was the main activity for nine-months of the last year of Catalyst.

OnSupply itself was focused on how people can better understand the availability of renewable energy. Our current model of energy production assumes electricity is always available ‘on demand’ and the power generation companies’ job is to provide it when wanted. However, renewable energy does not come when we want it, but when the wind blows, the tides run and the sun shines. That is in the future we need to shift to a model where energy is used when it is available, ‘on supply’ rather than ‘on demand’.

The Lancaster team, led by Adrian consisted of four full time researchers, Will, Steve, Peter, and of course, Maria, and the other project partners were Tiree Tech Wave, the Tiree Development Trust, Goldsmiths University, and Rory Gianni, an independent developer based in Scotland specialising in environmental issues.

The choice of Tiree was of course partly because of Tiree Tech Wave and my presence here, but also because of Tilly, the Tiree community wind turbine, and the slightly parlous state of the electricity cable between Tiree and the mainland. In many ways the island is just like being on the mainland, you flick the switch and electricity is there. While Tilly can provide nearly a megawatt at full capacity, this simply feeds into the grid, just like the wind farms you see over many hillsides.

However, there is also an extent to which we, as an island population, are more sensitised to issues of electricity and renewable energy.

TTW6_DanPictsForSaturdayPitch-3-604x270

First is the presence of Tilly, which can be seen from much of the island; while the power goes into the grid, when she turns this generates income, which funds various island projects and groups.

But, the same wind that drives Tilly (incidentally the most productive land-based turbine in the UK), shakes power lines, and at its wildest causes shorts and breakages. The fragile power reduces the lifetime of the sophisticated wireless routers, which provide broadband to half the island, and damages fridge compressors.

Furthermore, the aging sea-cable (now happily replaced) frequently broke so that island power was provided for months at a time from backup diesel generator. As well as filling the ferry with oil tankers, the generator cannot cope with the fluctuating power from Tilly, and so for months she is braked, meaning no electricity and so no money.

So, in some ways, a community perfect for investigating issues of awareness of energy production, sensitised enough that it will be easier to see impact, but similar enough to those on the mainland that lessons learnt can be transferred.

wirlygigThe project itself proceeded through a number of workshops and iterative stages, with prototypes designed to provoke discussions and engagement. My favourites were machines that delivered brightly coloured ping-pong balls as part of a game to explore energy uses, and wonderful self-assembly kits for the children, incorporating a wind and solar energy gauge.

The project culminated in a display at the Tiree Agricultural Show.

While OnSupply finished last summer, the reporting continues and a few weeks ago a paper about the project, to be presented at the CHI’2015 conference in South Korea in April, was given a best paper award at the CHI’2015 conference.

… and all this from a run on the beach.